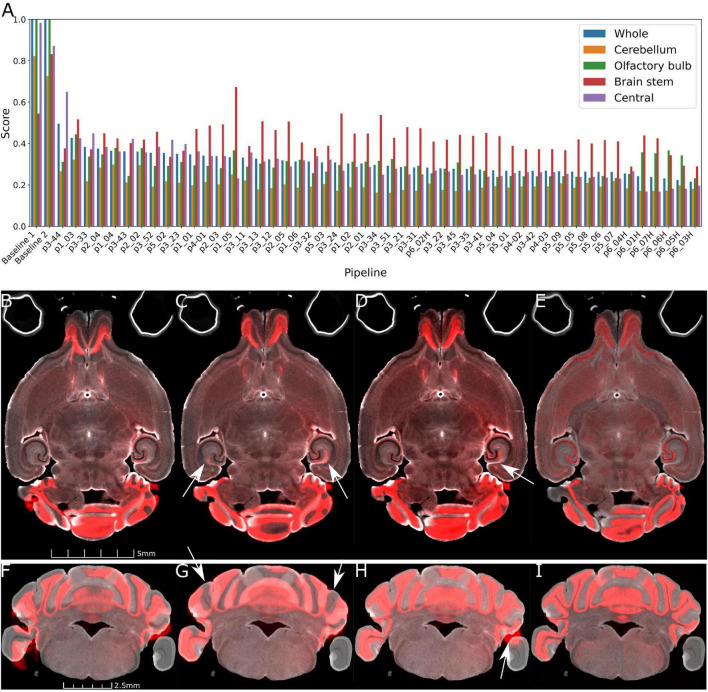
FIGURE 3.
Demonstration of the range of results derived from the varied pipes. (A) Shows the L2 norm for the pipes listed in Tables 2, 3 registering Syto16 to DWI (specimen 191209). (B) Shows that the initialization results in reasonable alignment in the central slice. But (F) shows that initialization fails in the distal slices in the cerebellum. (C,D,G,H) Show results at 45 μm with L2 norms of 0.361 using pipe P2_02. There are still significant errors in the cerebellum (arrows in panel G). (D,H) With pipe P3_42 performs better with a lower L2 norm of 0.268. Finally, a comparison of panels (D,H) (@ 45 μm) and (E,I) (@ 15 μm) with pipeline P6_07_H demonstrates the utility of performing the registration using the higher resolution data. The cerebellar slice in panels (F–I) highlights a frequent problem i.e., loss of the parafloculoss from handling. The broken symmetry in the data gives rise to asymmetric misalignment (arrows in panels C,D,H).

