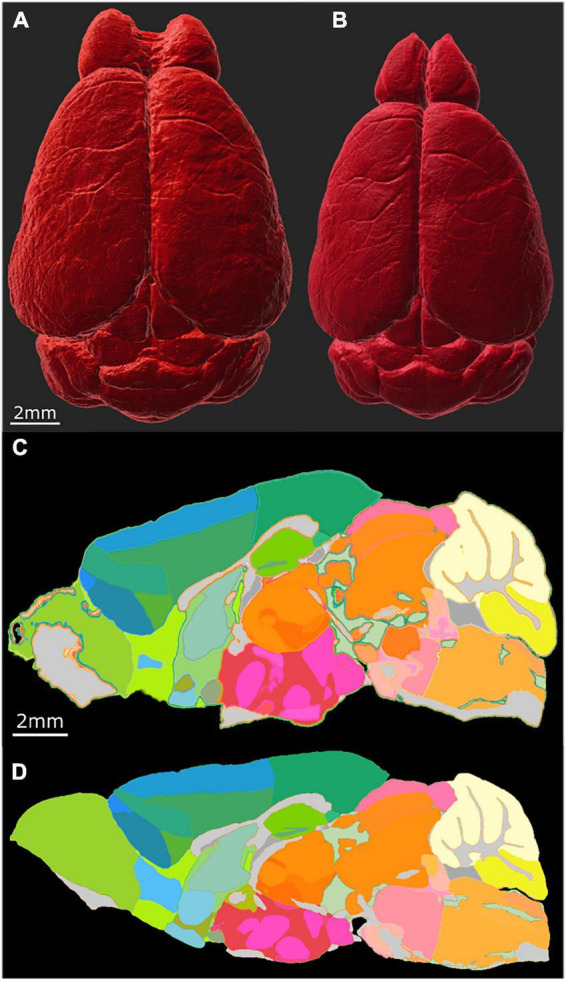
FIGURE 5.

Distortion correction of the LSM data by registration to the MRI of the same specimen (190108). (A) Surface rendering of uncorrected LSM volume and (B) corrected LSM volume. The scale bar is 2 mm. (C) Midsagittal section of the labels on the LSM data before correction; (D) midsagittal section after correction: the scale bar in panels (C,D) is 2 mm. The distortion is present both within the plane of section and across the plane making it difficult to define identical planes. The highlighted edges in panel (C) are an interpolation artifact.
