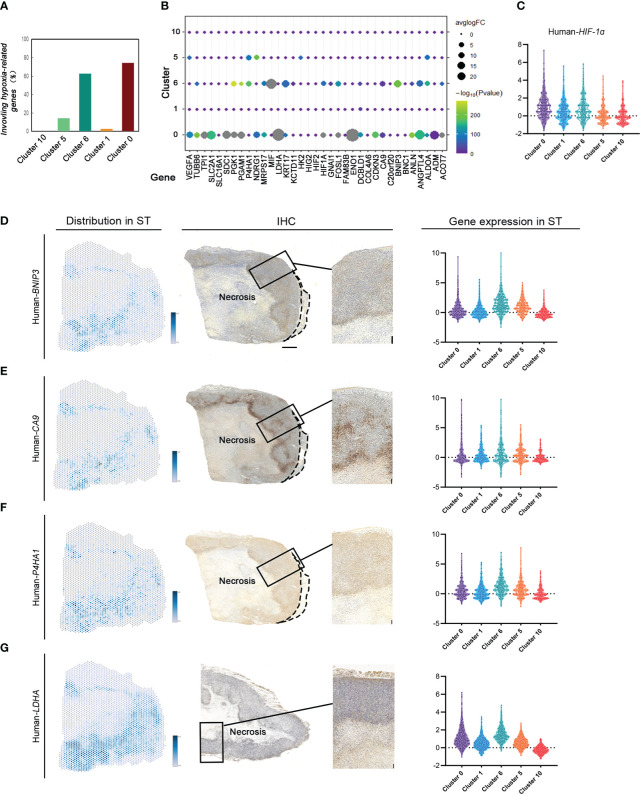
Figure 3.
ST identifies hypoxia-related gene expression and distribution based on different hypoxic conditions in MDA-MB-231 engrafts. (A) Number of hypoxia-related genes in cluster 0, cluster 1, cluster 6, cluster 5, and cluster 10. (B) Distribution of hypoxia-related genes in different clusters. (C) Violin plots of HIF1A expression in cluster 0, cluster 1, cluster 6, cluster 5, and cluster 10. (D–G) Spatial feature plots of Human BINP3, CA9, P4HA1, and LDHA in sample (C) IHC for human BINP3, CA9, and P4HA1 in sample C and LDHA in sample B (scale bar, 1 mm). Violin plots of these genes’ expression in cluster 0, cluster 1, cluster 6, cluster 5, and cluster 10.

