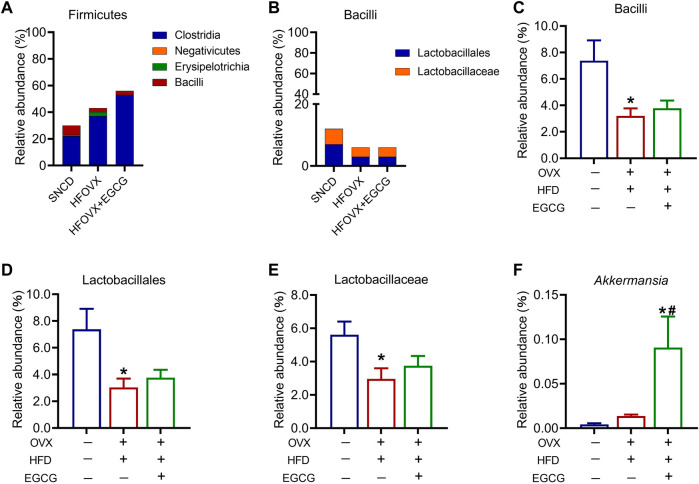
FIGURE 6.
Different abundances of gut microbiota in the Firmicutes and Verrucomicrobia. (A–B) Relative abundance of the composition of Firmicutes (A) and Bacilli (B). (C–F) Relative abundance of Bacilli (C), Lactobacillales (D), Lactobacillaceae (E), and Akkermansia (F) in the three groups. *p < 0.05 HFOVX group vs. SNCD group, or HFOVX + EGCG vs. SNCD group; # p < 0.05 HFOVX + EGCG vs. HFOVX group; n = 6–7 mice.

