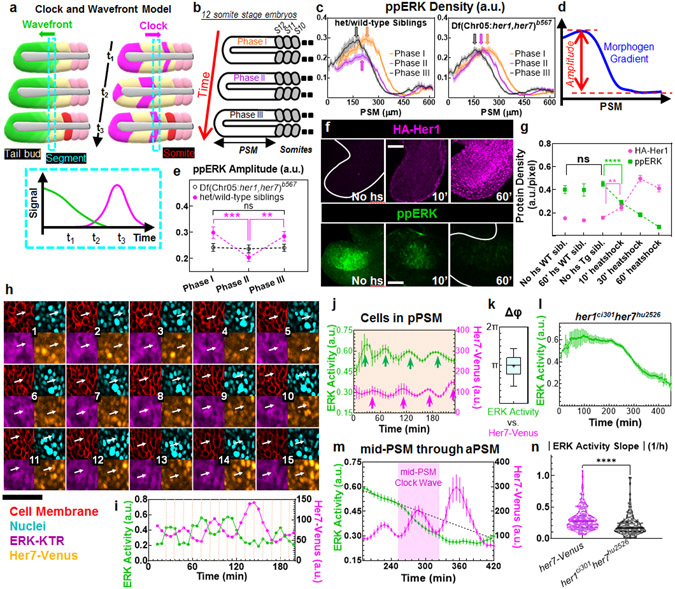
Fig. 1: Segmentation clock driven dynamics of ppERK gradient.
a, The CW model: The wavefront (a threshold of gradient, green) regresses following tail elongation. Segmentation clock (magenta) displays kinematic waves in opposite direction. Group of cells (cyan dashed box) commit to form next segment when the clock triggers them (bottom) and later buds off as a somite (red). b, Three phases of same stage embryos by their PSM lengths. c, ppERK dynamics in clock-intact siblings (left, n=24, 26, and 26 embryos over N=3 for Phases I, II, and III respectively) and clock-deficient mutants (right, n=22, 25, and 23 embryos over N=3 for Phases I, II, and III respectively). Data aligned from anterior (lab frame). d, Gradient amplitude: the difference between gradient peak and trough. e, Amplitude dynamics in (c). In mutants: p=0.95, 0.76, and 0.79; in siblings: p=0.0002, 0.54, and 0.0042 for Phases I-II, I-III, and II-III respectively. f, IHC for HA-Her1 (top) and ppERK (bottom). g, HA-Her1 levels (magenta, n= 42, 31, 28, 42, 39, and 28 embryos from left to right, over N=3) and ppERK gradient amplitudes (green, n=17, 15, 17, 44, 36, and 36 embryos from left to right, over N=3). p=0.013 (HA-Her1) and 0.0108 (ppERK); no heatshock transgenic controls – 10’ heatshock. p>0.9198 for ppERK, between no heatshock transgenic and two other controls. h, Snaphots (12 min intervals) of Her7-Venus (orange), ERK activity (purple), cell membrane (mCherry-CAAX, red), and nuclei (H2B-iRFP, cyan). Arrow tracks a pPSM cell for 3 hours. ERK activity reporter translocates between cytoplasm and nucleus periodically. i, ERK activity and clock dynamics for the tracked cell in (h). j, Clock (magenta) and ERK activity (green) dynamics for pPSM cells (orange shade, n=271 tracked cells from 8 embryos over N=5). Arrows indicate peaks. k, Phase difference between ERK activity and clock (n=133 pPSM cells from 8 embryos over N=5; Box (median and interquartile range) and whisker (10th – 90th percentile) plot. Plus is mean. l, ERK activity in clock mutants (n=242 cells from 7 embryos over N=4). m, Clock (magenta) and ERK activity (green) dynamics for cells displaced through mid-PSM to aPSM (n=271 cells from 8 embryos over N=5). Dashed line is linear fit to 30 min data preceding mid-PSM clock wave (purple shade). n, ERK activity decline during mid-PSM clock waves of clock-intact embryos (magenta, n=197 cells from 8 embryos over N=5) and corresponding interval in mutants (black, n=169 cells from 7 embryos over N=4). Violin plots with median (solid) and quartiles (dashed lines). p<0.0001. More details on statistics and reproducibility can be found in the Methods section. All images are lateral view, dorsal is bottom. Posterior is left. Scale bars are 50 μm. N=independent experiments. Data is mean±s.e.m in (c), (e), (g), (j), (l), and (m).

