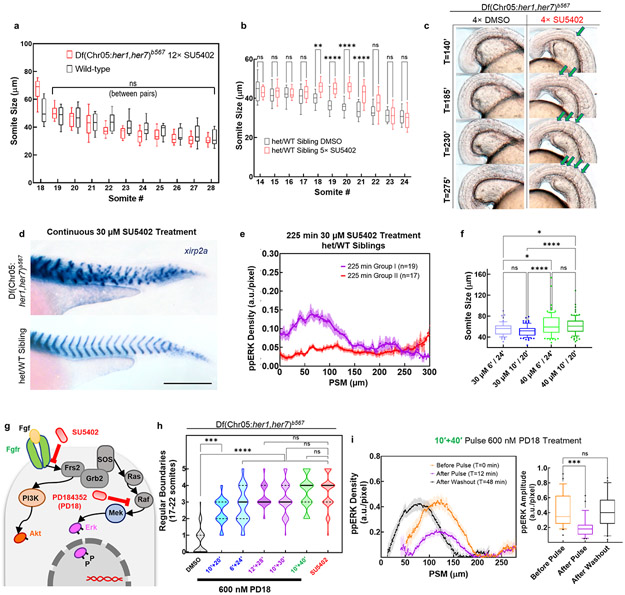
Extended Data Figure 6: Pulsatile inhibition of ppERK activity simulates the effect of the clock.
a, Sizes of 18th to 28th somites measured from DIC images of 12-pulse experiments (box (median and interquartile range) and whisker (10th – 90th percentile) plot): induced somites in clock mutants treated with SU5402 (red, n=23 embryos over 3 independent experiments) and wild-type embryos treated with DMSO (black, n=17 embryos over 2 independent experiments). p=0.0544 – 0.9929 (n.s.) for all induced somites except the first one (p<0.0001 for the 18th somite, 2-way ANOVA with Tukey’s test for multiple comparison). b, SU5402 (5 pulses) increased sizes of 17th – 22nd somites in clock-intact embryos (n=19 for DMSO, n=26 for SU5402, p=0.0034 for 18th somite and p<0.0001 for 19th, 20th, and 21st somites, 2-way ANOVA with Tukey’s test for multiple comparison; box (median and interquartile range) and whisker (10th – 90th percentile) plot). c, Time-lapse images taken every 45 min beginning from the appearance of first induced boundary at T=140 min with first drug pulse (n=36 embryos over 2 independent experiments). Induced boundaries are highlighted with green arrows (right). DMSO treated clock mutants (n=25 embryos over 2 independent experiments) could not induce any boundaries (left). Lateral view. Note that there is a 3-somite delay from first pulse to first affected boundary in (b) and (c). d, Representative xirp2a boundary staining of clock-deficient mutant (top) or clock-intact sibling (bottom) embryos treated with same concentration (30 μM) SU5402 beginning at 12 somite stage for 225 min at 28°C. Scale bar is 200 μm. e, At the end of 225 min 30 μM SU5402 treatment, clock intact embryos displayed bi-modal distribution of ERK activity (n=19 embryos in Group I, magenta, and n=17 embryos in Group II, red over 2 independent experiments). Approximately half of SU5402 treated sibling embryos could not survive to later stages for xirp2 staining, while the other half formed some segments before onset of axis truncation, indicating necessity of ERK activity gradient for survival and segmentation. f, Induced somite sizes for changing concentrations and durations of drug treatments performed at room temperature, for five pulses; measured from xirp2a boundary staining (box (median and interquartile range) and whisker (10th – 90th percentile) plot and outliers as individual dots, n=59, 88, 96 and 84 induced somites from left to right respectively). p>0.1998 for n.s. comparisons, p=0.0007 between 30 μM, 10 min treatment and 40 μM, 6 min treatment and p<0.0001 for other comparisons (Kruskal-Wallis ANOVA test with Benjamini-Krieger-Yekutieli false discovery rate multiple comparison correction). g, MEK inhibitor drug PD184352 directly targets ERK activity downstream of Fgf receptor. h, Various durations of 5 pulses of PD184352 (600 nM) can induce somite boundaries (scored by xirp2a staining from left to right, n=58, 36, 44, 52, 54, 44 embryos over 3 independent experiments, in comparison to SU5402 treatment in Fig. 2j; n=170 embryos). Truncated violin plots with solid median and dashed quartile lines. p=0.0002 for DMSO vs. 10’-20’ treatment, p<0.0001 for DMSO vs. other comparisons, and p>0.3312 for SU5402 vs. PD184352 comparisons (Kruskal-Wallis ANOVA test with Benjamini-Krieger-Yekutieli false discovery rate multiple comparison correction). i, ppERK gradient along the PSM with 10’-40’ PD184352 pulses (n=24, 24, and 24 embryos over 2 independent experiments, for before pulse, after pulse, and after recovery from the treatment (before next pulse), mean±s.e.m.). Amplitude comparison is shown on the right (10-90th percentile box-whisker plot together with outlier dots, p=0.0001 for before vs. after pulse, p=0.8528 for before pulse vs. after washout; Brown-Forsythe ANOVA, unpaired two-tailed test with Welch correction).

