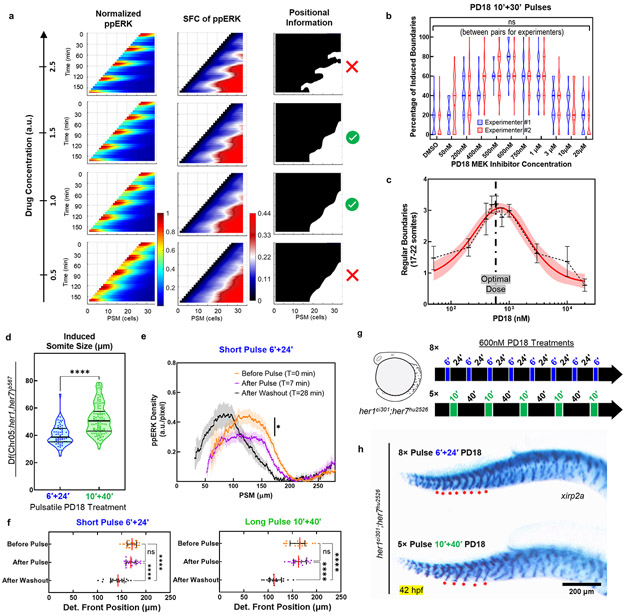
Extended Data Figure 8: Somite segmentation in mutants can be induced within a range of conditions.
a, Simulation of the COG model predicts only a medium dose of inhibitory treatment would result in discretization of positional information, i.e., successfully induce somite boundaries. SFC detection (middle) could extract reliable positional information (right, critical SFC threshold) from an oscillatory ppERK gradient (left) for a certain range of drug concentrations (middle rows). b, Percentage of successfully induced boundaries (# of intact boundaries over # of pulses) is assessed from xirp2a staining by two independent experimenters for various doses of five 10’+30’ PD184352 pulses (DMSO control left, n=58 embryos; PD184352 from 50 nM up to 20 μM, n=44, 70, 18, 54, 54, 50, 90, 48, 22, 64 embryos over 3 independent experiments, respectively, truncated violin plot with solid lines indicating quartiles). p=0.9824, 0.0932, 0.4365, 0.8045, 0.9824, 0.0633, 0.7284, 0.6164, 0.9824, 0.9824 and 0.1502 between experimenters from left to right resp., 2-way ANOVA with Holm-Šidák test for multiple comparisons. c, Number of induced boundaries (data in (b)) for various doses (black, mean±95% C.I.), fitted with a bell-shaped dose response curve (red solid line with 95% C.I.) in logarithmic scale. Vertical dashed line indicates optimal dose for boundary recovery. d, Induced somite sizes for either short (blue, 6’+24’) or long (10’+40’) pulses of 600 nM PD184352 (5×). Somite sizes are measured from xirp2a boundary staining (n=136 induced somites for long and n=58 induced somites for short pulses over 2 independent experiments). p<0.0001, Welch’s two-tailed t-test. Truncated violin plot, median as solid thick line, and scatter plot of all data points. e, IHC quantification of ppERK gradient along the PSM for short PD184352 pulses (n=25, 23, and 18 embryos over 2 independent experiments, for before pulse, after pulse, and before the next pulse). p=0.0391 between before pulse and after pulse (Brown-Forsythe ANOVA, unpaired two-tailed test with Welch correction). mean±s.e.m. f, Determination front position (scatter dots with median (red) and interquartile range error bars) in short (left) and long (right) pulse PD184352 treatments, quantified from data in panel (e) and Extended Data Fig. 6i. p=0.9987 and 0.9939 for before vs. after pulse in short and long pulse treatments respectively. p<0.0001 for other comparisons (Brown-Forsythe and Welch ANOVA tests with Dunnett’s T3 correction for multiple comparisons). Determination front stalls during drug treatment and shifts during recovery, similar to that in clock-intact embryos in Fig. 4b. g, Design of the experiment for splitting comparable sizes of trunk axes into varying numbers of induced somites with either 8× short or 5× long pulses of MEK inhibition in her1ci301her7hu2526 clock mutants. h, xirp2a staining for successfully induced somites with either small (top, short pulse, n=50 embryos over 2 independent experiments) or large (bottom, long pulse, n=59 embryos over 2 independent experiments) sizes in clock mutants. Red stars indicate induced somite boundaries covering same region of the trunk. Posterior is left.

