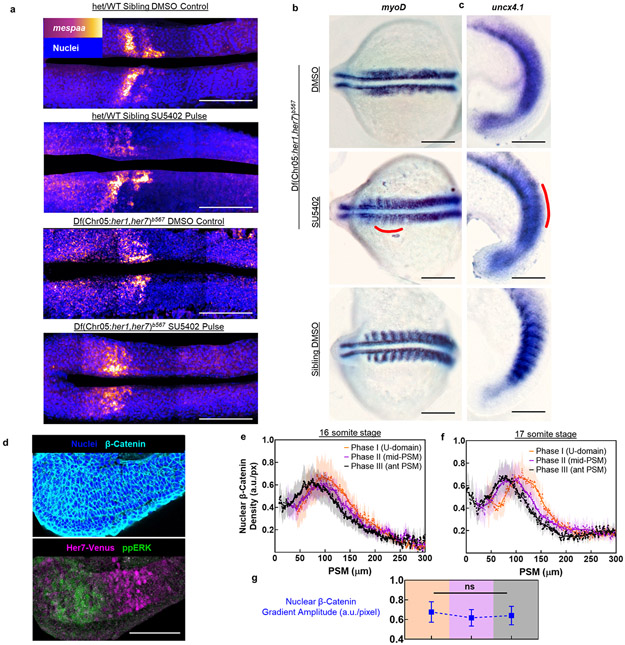
Extended Data Figure 9: Kinematic stripes of clock are required for establishment of R-C polarity in somites and nuclear β-Catenin gradient does not oscillate.
a, Fluorescent in situ hybridization of mespaa with nuclei staining (blue, dorsal view). Clock-intact sibling embryos treated with DMSO (top, n=14) or SU5402 (second row, n=9) and clock mutants (bottom rows; n=14, and n=13 respectively). Embryos were fixed at the end of 4th drug treatment pulse. b, in situ hybridization of myoD for DMSO (top, n=15) or SU5402 (middle, n=22) treated clock mutants as well as DMSO treated clock-intact siblings (bottom, n=12). Embryos were fixed 2 h after 4th drug pulse. Induced boundary area is shown with red line. c, in situ hybridization of uncx4.1 for DMSO (top, n=22) or SU5402 (middle, n=29) treated clock mutants as well as DMSO treated clock-intact siblings (bottom, n=11). Embryos were fixed 2 h after 5th drug pulse. Induced boundary area is shown with red line. d, Cell nuclei (Hoescht 33682, blue) and immunofluorescence signals from antibodies against β-Catenin (cyan), Her7-Venus (magenta), and ppERK (green) proteins at 16 somite stage (N=2). e-f, Nuclear density profiles of β-Catenin proteins along the PSM at 16 (e) and 17 (f) somite stage embryos grouped into U-domain (Phase I, n=13, 16 somite stage; n=13, 17 somite stage), mid- PSM (Phase II, n=15, 16 somite stage; n=14, 17 somite stage), and aPSM (Phase III, n=19, 16 somite stage; n=13, 17 somite stage) phases of clock expression. g, Amplitude quantification of nuclear β-Catenin (blue) gradient for three clock phases of 16-17 somite stages (N=2, n=26, 29, and 32). p>0.6594 for all phases (Welch’s two-tailed tests). Lines and shaded error bars indicate mean±s.e.m. All microscopy images except panels (c) and (d) are dorsal views. Images in (c) and (d) are lateral views. Posterior is bottom / left. Black scale bars are 200 μm. White scale bars are 100 μm.

