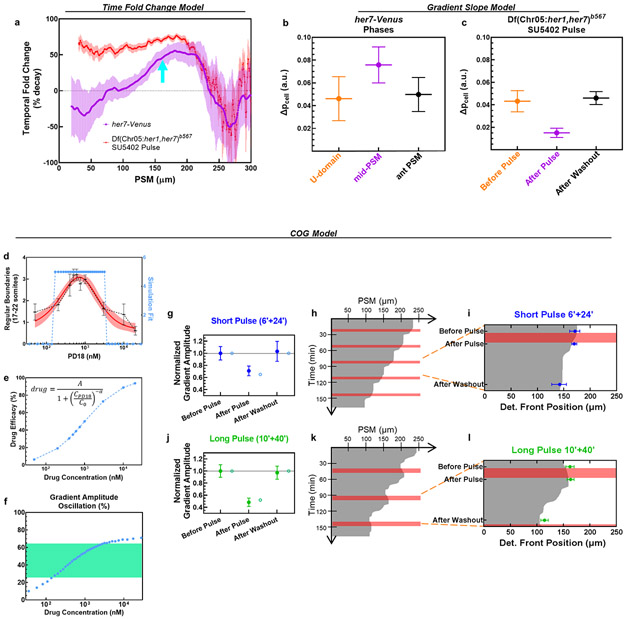
Extended Data Figure 10: Alternative signal readout models fail to explain segmental commitment whereas COG model fits observed results.
a, Temporal fold change of ppERK signal throughout the PSM, calculated for clock-intact her7-Venus reporter fish (magenta; from Extended Data Fig. 4f, Phase II–III transition) or SU5402 pulse treated clock-deficient mutants (red; from Fig. 2f, Before Pulse – After Pulse transition) at same stage. Determination front position in clock-intact embryos is indicated with cyan arrow. b-c, Slope of ppERK gradient (reported as ppERK signal difference over a cell distance) for three clock phases in her7-Venus reporter embryos (b; from Extended Data Fig. 4f) or SU5402 pulse treated clock-deficient mutants (c; from Fig. 2f). Data is shown as mean±s.e.m. (d) Simulations of COG model with varying drug parameter (light blue, right axis) fit to experimental data for PD184352 dose optimization in Extended Data Fig. 8c (mean±95% C.I.). (e) Experimental doses used in Extended Data Fig. 8c are converted into drug efficacy from the simulation fit in (d). Fit parameters are provided in Supplementary Table 1. (f) ppERK gradient amplitude oscillations driven by varying drug concentrations. Green zone highlights (26%-65%) amplitude oscillations for the doses succeeding to drive somite segmentation in (d). (g) ppERK Amplitude changes from the simulation of short pulse (6’+24’, blue) 600 nM PD184352 treatment (hollow circles, 35% drop) matching with experimental data in Ext. Data Fig. 8e (mean±s.e.m., normalized to before pulse). (h) Positional information (critical SFC of ppERK, 22%) kymograph (gray below, white above threshold) for short pulse simulations. Pink stripes highlight 6 min drug treatment pulses. Determination front makes 31.4 μm shifts every 30 min. (i) Determination front dynamics from the simulations overlaid with the experimental data in Extended Data Fig. 8f (blue, median, error bars are interquartile range). (j) ppERK Amplitude changes from the simulation of long pulse (10’+40’, blue) 600 nM PD184352 treatment (hollow circles, 48% drop) matching with experimental data in Extended Data Fig. 6i (mean±s.e.m., normalized to before pulse). (k) Positional information kymograph for long pulse simulations. Pink stripes highlight 10 min drug treatment pulses. Determination front makes 49.8 μm shifts every 50 min. (l) Determination front dynamics from the simulations overlaid with the experimental data in Extended Data Fig. 8f (green, median, error bars are interquartile range).

