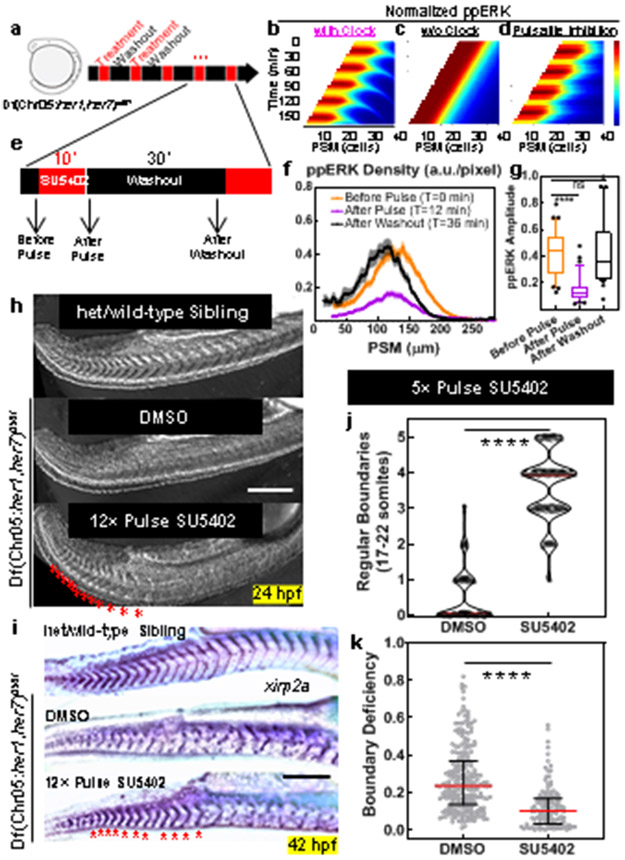
Fig. 2: Global periodic inhibition of Fgf signaling drives sequential segmentation of somites in the absence of clock.
a, Design of pulsatile inhibition experiment in clock-deficient mutants. b-d, Simulation kymographs (time vertical down, space, horizontal) of ppERK gradient dynamics under the influence of clock (b), in the absence of clock (c), and with pulsatile inhibition (d). e, Clock-deficient mutants are treated with either 30μM SU5402 or corresponding DMSO dilution (1:333) in a pulsatile manner (10′ treatment and 30′ washout cycles) alongside their clock-intact siblings. f, ppERK gradient of the mutants during SU5402 pulse experiments (mean±s.e.m.). Embryos were fixed right before the 4th pulse (T0=0 min, n=34 embryos), immediately following the 4th pulse (T1=12 min, n=37 embryos), and before the 5th pulse (T2=36 min, n=30 embryos) over 2 independent experiments. g, Gradient amplitude oscillations of data in (f). Box (median and interquartile range) and whisker (10th – 90th percentile) plot with individual outliers. p<0.0001 and p>0.9999 for T0-T1 and T0-T2 respectively (Kruskal-Wallis ANOVA test with Dunn’s multiple comparison correction). h, In-focus plane projection from DIC-Nomarski imaging of live sibling embryos 2 h after the 12 pulses of drug treatment: clock-intact (top), DMSO-treated mutant (middle) and SU5402-treated mutant (bottom). Red stars mark induced boundaries (over 3 independent experiments). i, xirp2a stained clock-intact sibling (top), and DMSO (control, middle) or SU5402 (12 pulses, bottom) treated clock-deficient mutants. Stars show pulse-induced intact boundaries (n=15 embryos over 3 independent experiments). j, Computerized quantification of intact boundaries in DMSO control (n=156 boundaries over 3 independent experiments) or SU5402 treated (n=170 boundaries over 3 independent experiments) clock-deficient mutants. Violin plot with median (red solid) and quartiles (black dashed). Integer data is randomly jittered by ±0.05 to aid visibility. p<0.0001, unpaired two-tailed Welch t-test. k, Deficiency of remaining still-broken boundaries. Median (red) and interquartile range (error bars) with individual data points. p<0.0001 (two-tailed Mann-Whitney test), n=227/240 and n=91/240 boundaries for DMSO and SU5402 respectively. Scale bars are 200 μm. Posterior is left.

