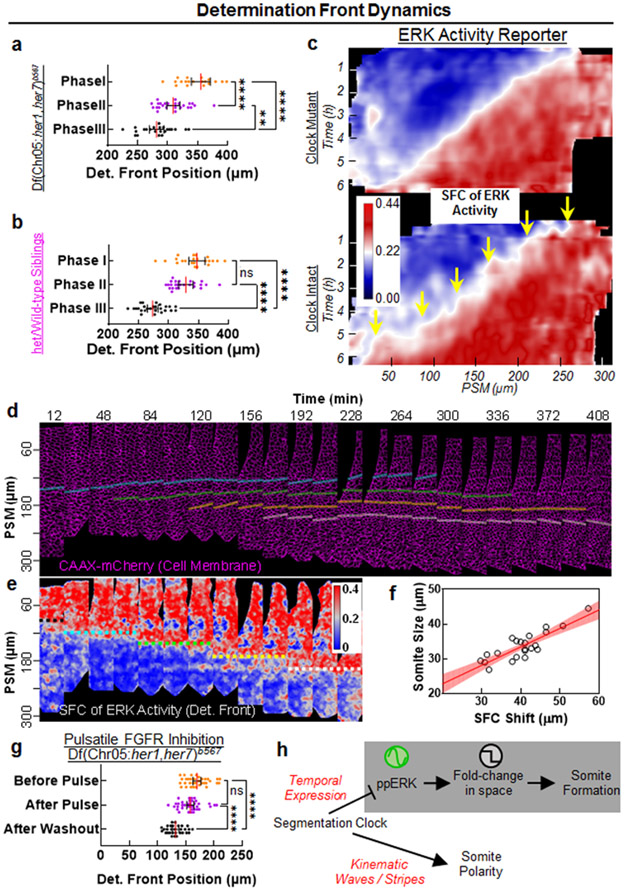
Fig. 4: Clock discretizes the positional information.
a-b, Regression of determination front position for three phases of clock mutants (a, n=22, 25, and 23 embryos from 3 independent experiments, respectively) and of clock-intact siblings (b, n=24, 26, and 26 embryos from 3 independent experiments, respectively) calculated as the position of critical SFC of ppERK. In mutants: p=0.0029 for Phase II-III, p<0.0001 for Phase I-II and Phase I-III; in clock-intact siblings: p=0.1179 for Phase I-II, p<0.0001 for Phase I-III and Phase II-III (Brown-Forsythe and Welch ANOVA tests with Dunnett’s T3 correction for multiple comparisons). c, SFC of ERK activity kymograph of clock-intact embryos (n=6 embryos over 3 independent experiments) or clock mutants (n=8 embryos over 4 independent experiments). White transition color of look up table matches to the critical SFC value for segmental commitment. Yellow arrows show discrete dynamics of SFC. d-e, Snapshots (18 min intervals) of PSM tissue (lateral view, cell membrane marker, magenta) over the course of a 7h movie of a clock-intact embryo (d) and corresponding snapshots of SFC of ERK activity (e). Cells experiencing the discrete shifts of SFC within the first 4h (determination, dashed colored lines, e) are tracked until they establish somite boundaries (solid lines starting from a frame before determination, d). Tissue is straightened along the A-P axis. Posterior is bottom. Dorsal is left. f, SFC shifts correlate with final somite sizes in tracked boundaries (n=22 somites observed in 6 embryos). Red line is linear fit with 95% C.I. (R2=0.73). g, Determination front position for pulsatile SU5402 treated clock-deficient mutants (Fig. 2f; T0=0 min: n=34; T1=12 min: n=37; T2=36 min: n=30 embryos over 2 independent experiments) as quantified from SFC of ppERK levels for three time points (p=0.0894 for before pulse to after pulse and p<0.0001 for both before pulse to after washout and after pulse to after washout, Kruskal-Wallis ANOVA test with Dunn’s multiple comparison correction). h, The segmentation clock drives segmental commitment in mid-PSM and separately instruct RC polarity in aPSM. Individual data points are shown in panels (a), (b) and (g) together with median (red) and interquartile range (error bars). Posterior is left, except in (d) and (e).

