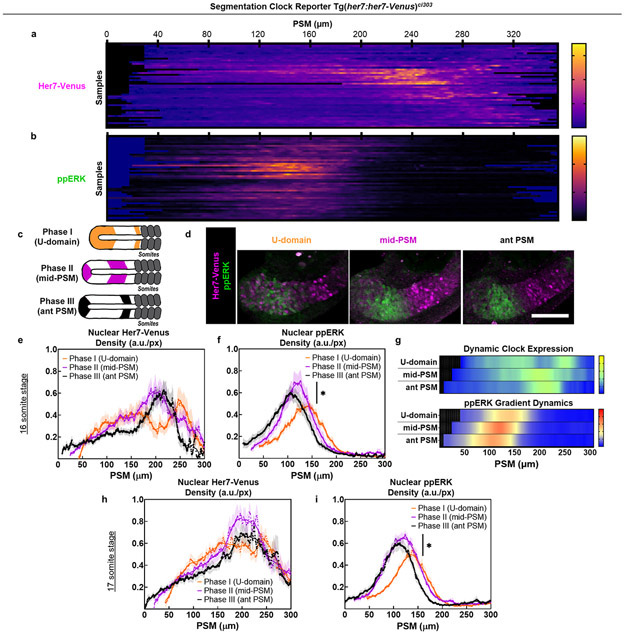
Extended Data Figure 4: ppERK gradient oscillates in the PSM correlated with clock expression.
a-b, Kymographs of IHC data of Her7-Venus (a) and ppERK (b) from 16 somite stage embryos (n=47) ordered according to their clock phases. c, Same stage embryos can be grouped into three phases according to their clock expression along the PSM: U-domain (Phase I, orange), mid-PSM stripe (Phase II, purple), and aPSM stripe (Phase III, black). d, Representative pictures of Her7-Venus (magenta) and ppERK (green) for three phases of clock expression (N=2). Scale bar is 100 μm e-f, Nuclear density profiles of Her7-Venus (e) and ppERK (f) along the PSM for each group at 16 somite stage embryos (U-domain, Phase I, n=14; mid-PSM, Phase II, n=15, and aPSM, Phase III, n=19). p=0.0326 (Welch’s two-tailed t-test) between U-domain and mid-PSM ppERK peaks. g, Kymographs of Her7-Venus (top) and ppERK (bottom) for three phases of 16 somite stage IHC data (n=17, 16, and 17 embryos over 2 independent experiments). h-i, Nuclear density profiles of Her7-Venus (h) and ppERK (i) along the PSM for each group at 17 somite stage embryos (U-domain, Phase I, n=13; mid-PSM, Phase II, n=14, and aPSM, Phase III, n=13). p=0.0148 (Welch’s two-tailed t-test) between U-domain and mid-PSM ppERK peaks. Lines and shaded error bars indicate mean±s.e.m. in (e,f,h,i). Posterior is left. Note that ppERK level is higher when the PSM size is the smallest in Fig. 1c while it is lower in the corresponding phase in this figure. This difference is due to the change of clock phase profiles over different somite stages as shown in 46.

