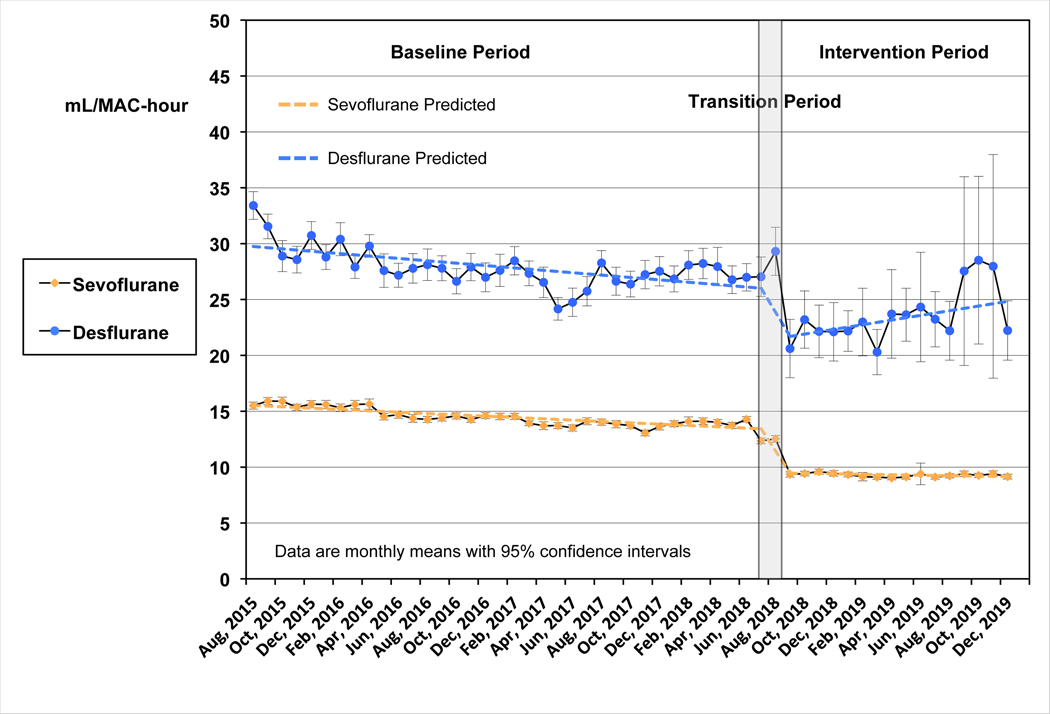
Figure 3:
Interrupted time series analysis: Monthly mean mL/MAC-hour for sevoflurane and desflurane. Data for mL/MAC-hour are shown as monthly means with 95% confidence intervals. Sevoflurane is shown in yellow as indicated, and desflurane in blue. The baseline period was from July 22, 2015 to July 10, 2018. The intervention period began August 29, 2018. The transition period (July 11, 2018 to August 28, 2018), where data were excluded for statistical analysis, is indicated by the gray shaded rectangle. The predicted data lines are shown for each agent, derived from the interrupted time series analysis. The mL/MAC-hour showed a statistically significant downward trend for both sevoflurane and desflurane during the baseline period, P<0.0001. The drop in anesthetic agent use at the intervention was also statistically significant (P<0.0001). For sevoflurane this decrease was 3.8 mL/MAC-hours (95% CI: 3.6 to 4.1); for desflurane the decrease was 4.1 mL/MAC-hour (95% CI: 2.6 to 5.6). Sevoflurane use continued to show a small but statistically significant downward trend during the intervention period (P=0.02), while a small upward trend for desflurane was not statistically significant (P=0.06). MAC, mean alveolar concentration.

