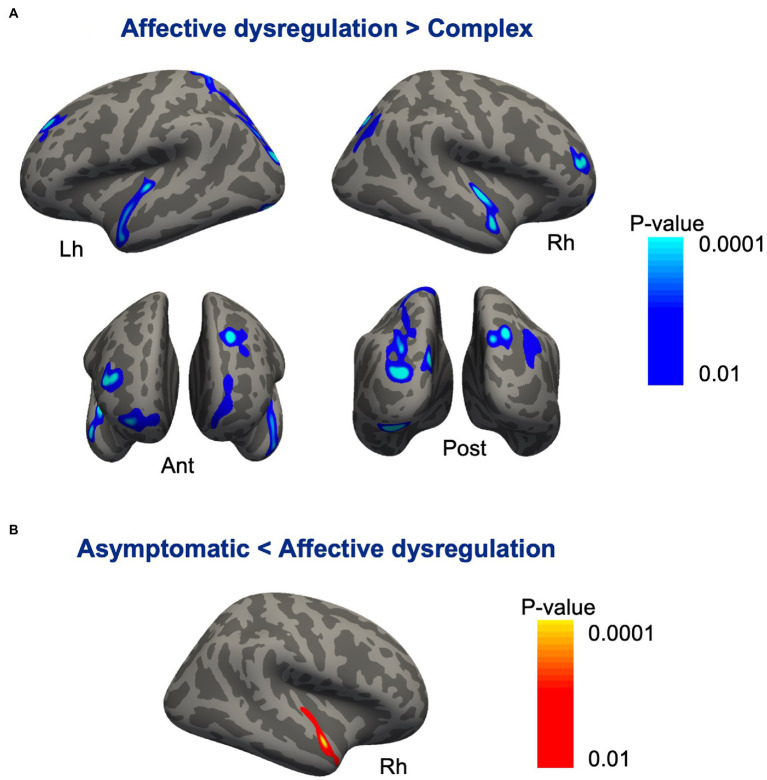
Figure 2.
Cortical regions showing differences between the subgroups of pariticipants classified based on profiles of MBI domain symptoms. (A) Compared with the affective dysregulation group, the complex group revealed cortical thinning bilaterally in the inferior parietal cortex, lateral occipital cortex, lateral superior temporal gyrus, and frontopolar cortex. (B) The affective dysregulation group showed thicker cortex in the right superior temporal gyrus than the asymptomatic group.

