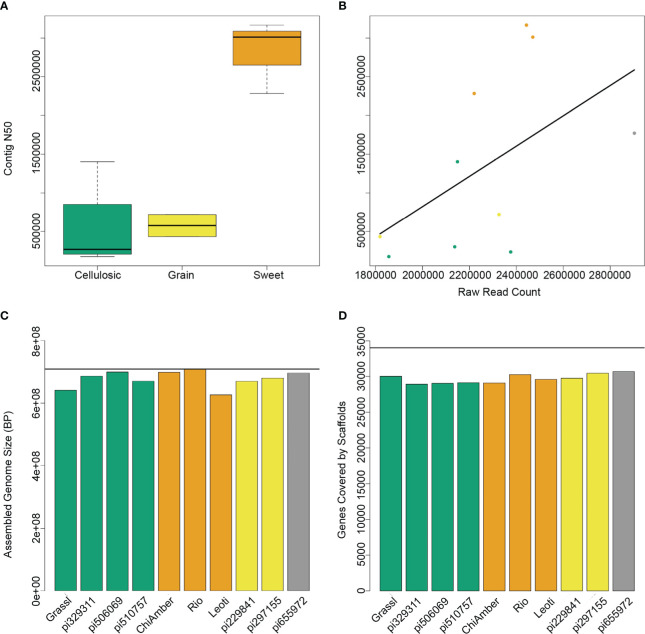
Figure 1.
Assembly metrics for 10 sorghum genotypes. (A) Contig N50 levels for different ideotypes show higher contiguity for sweet genotypes. (B) Raw read counts prior to assembly are highly correlated with contig N50, and sweet genotypes (orange) have higher read counts than cellulosic (green) or grain (yellow) genotypes. (C) Assembled genome size after scaffolding and filtering for each genotype shows that despite differences in mean contig size, the final assemblies for both sweet and non-sweet types are very close to the expected reference genome size (horizontal black line). (D) The number of BTx623 genes contained within the final scaffolds is very similar across all genotypes regardless of type.

