
FIGURE 4.
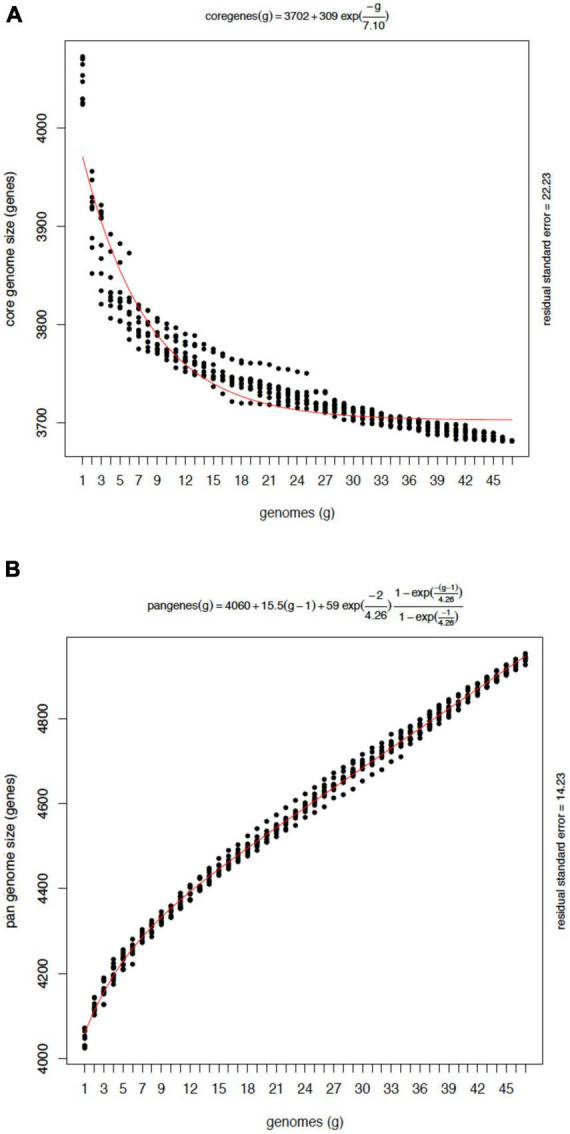
Composition analysis of the core and the pan-genome of Mtb L4 from 47 genomes. (A) Each point on the Y-axis indicates the number of gene clusters after adding a new genome in randomized simulations. The line red indicates the exponential decay as a function of the average values of the clusters each time a genome was added to the analysis. (B) Pan-genome growth simulation by counting new genes added by the last genome sampled. Note that sequences matching a previously seen gene coverage ≥20% will be considered homologous and thus won’t be considered new. An open pan genome model is observed.