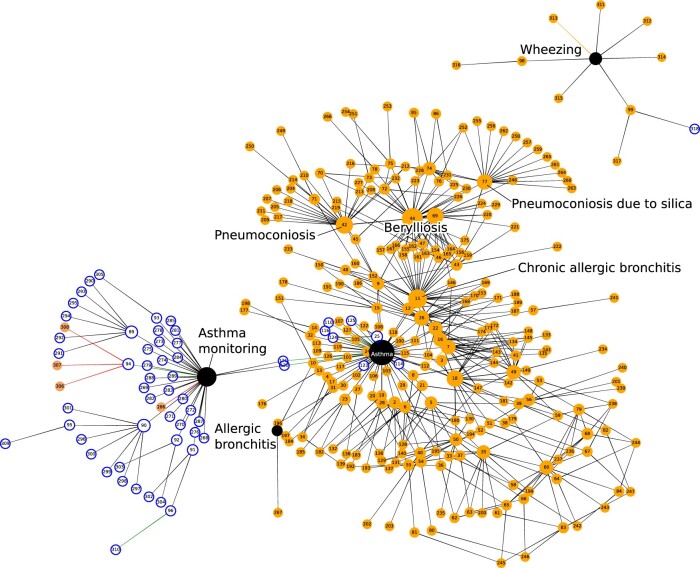
Figure 4.
Concept network diagram for the asthma “value set” phenotype definition, with key concepts labeled. Key to node colors: black with white text = primary concept, orange = linked finding or disorder, white with blue outline = linked concepts of other semantic types eg, procedure or regime/therapy. Edges represent relationship types: black = “Is a,” green = “Has focus,” red = “Associated procedure,” and orange = “Associated finding.”

