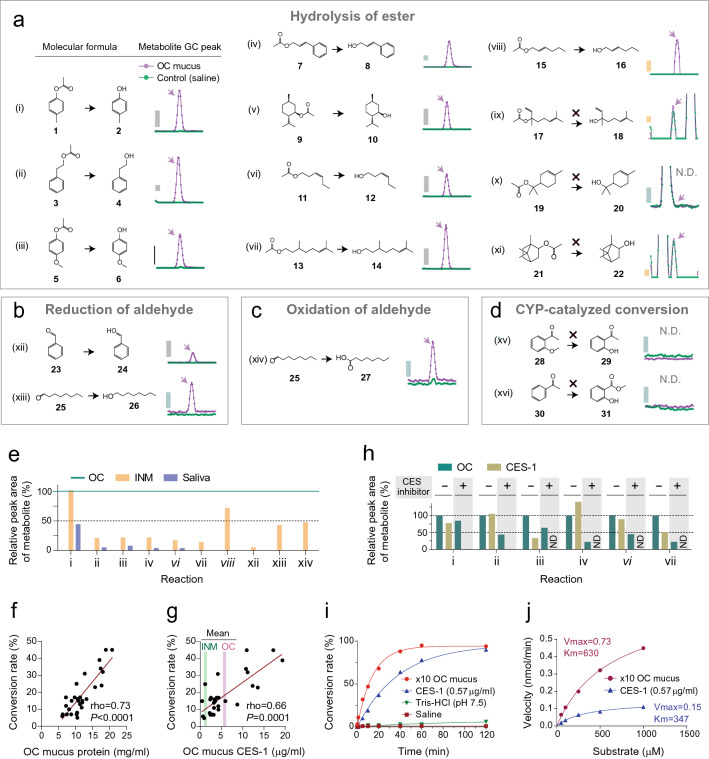
Figure 3.
Enzymatic activity of the olfactory mucus. (a–d) Assumed enzymatic activity of olfactory cleft (OC) mucus and the detection of resulting metabolites. Odorants were incubated in saline or OC mucus. The reactant was extracted using ethyl acetate and analyzed using gas chromatography/mass spectrometry (GC/MS). Intensity of total ion or extracted ion peaks was normalized to a peak area of ester 19, which did not undergo OC mucus-mediated conversion. Grey and blue bars represent normalized total ion intensities of 20,000 and 2000, respectively. Yellow bar represents an extracted ion intensity of 50. (e) Comparison of enzymatic activity of the OC mucus with inferior nasal meatus (INM) mucus and saliva. The amounts of product in each enzymatic conversion are presented as normalized values, where a peak area of metabolite in OC mucus is set to 100%. (f) Individual difference in enzymatic activity of OC mucus and its association with the concentration of protein. Esterase activity of individual × 10 OC mucus was evaluated based on a conversion rate as [p-cresol (mol)]/([pCA (mol)] + [p-cresol (mol)]) 5 min after p-cresyl acetate (pCA) was applied to OC mucus (n = 29). (g) Association between esterase activity and carboxylesterase 1 (CES-1) concentration in OC mucus (n = 29). Green and magenta lines denote mean values of INM and OC mucus, respectively. (h) Substrate selectivity of OC mucus and CES-1. Recombinant CES-1 did not show identical reactivity with OC mucus. OC mucus showed residual activity under CES inhibitors (bis(4-nitrophenyl) phosphate), which completely inhibited CES-1. Inter-sample variability of the detected peak area was corrected using the peak area of non-metabolized ester 19. (i) Time course of the conversion rate from pCA to p-cresol in × 10 diluted OC mucus or CES-1 solution. The reaction proceeded linearly up to 5 min after the addition of pCA in the ten-fold diluted OC mucus and up to 40 min in the CES-1 solution. (j) Michaelis–Menten plot of pCA metabolism in × 10 diluted OC mucus or CES-1 solution. Various concentrations of pCA were added, and the conversion rate was measured at each time. ND, not detected.

