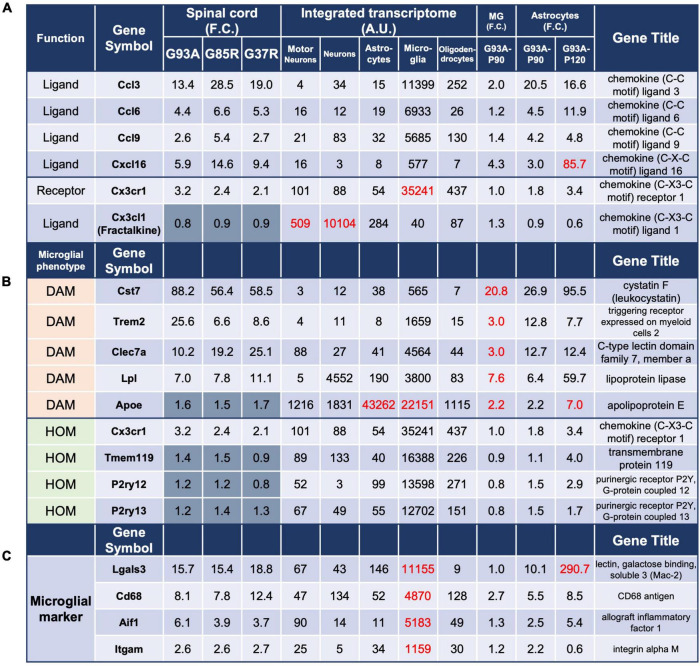
FIGURE 4.
Analysis of genes in 207 DEGs using integrated and SOD1G93A cell-type transcriptomes. The gene expressions for panel (A) chemokines and their receptors, (B) microglial phenotype: DAM and HOM, and (C) ectopic expression of Lgals3 are shown. The description of each column is the same as in Figure 3. DAM, disease-associated microglia; HOM, homeostatic microglia; MG, microglia.

