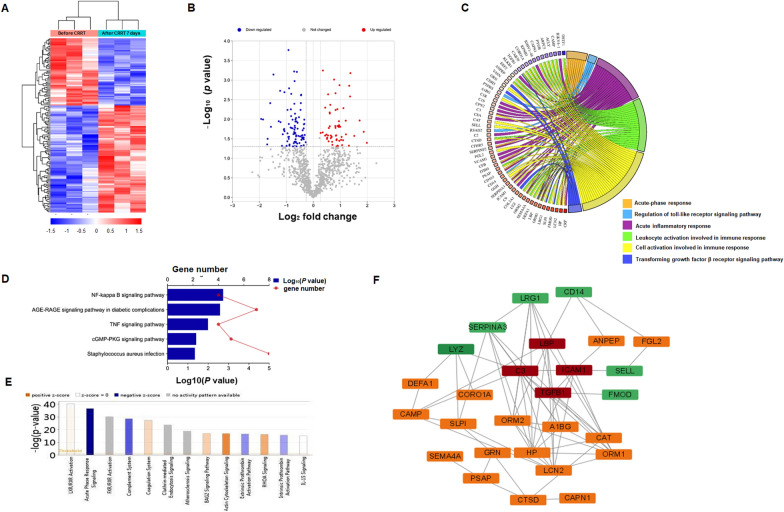
Fig. 2.
Serum proteomics analysis in 3 pediatric patients with severesepsis as a discovery set. A Heatmap visualization of 145 differentially expressed proteins. B Volcano plot of differentially expressed proteins. C Distribution of altered proteins for biological processes. Only GO terms that were significantly overrepresented (p < 0.05) are shown. D Significantly enriched pathways identified by KEGG pathway analysis (p < 0.05). E The canonical pathways obtained by IPA analysis. The Y-axis represents the ratio of the number of genes from the dataset that map to the pathway and the number of all known genes ascribed to the pathway. F Interconnections between differentially expressed proteins in the process of cell activation involved in immune response

