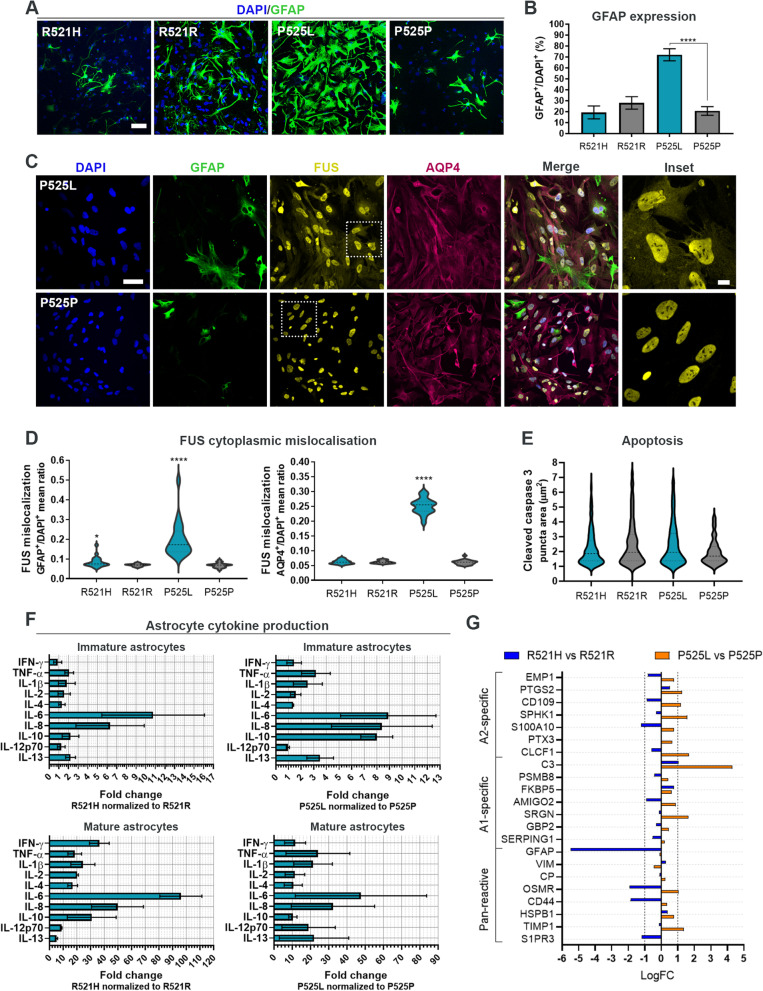
Fig. 2.
FUS-ALS astrocytes display increased reactivity. A Confocal images of GFAP expression in 4 weeks mature astrocytes. Nuclei stained with DAPI. Scale bar: 75 μm. B Quantification of GFAP expression. One-way ANOVA with Tukey’s multiple comparisons test. Mean ± s.e.m. of 3 biological replicates (n = 15 images). ****p < 0.0001. C Representative confocal images of FUS protein localisation in 4-week mature P525L and P525P astrocytes. Nuclei stained with DAPI. Scale bar: 50 μm. Inset scale bar: 10 μm. D Violin plot of FUS cytoplasmic mislocalisation in GFAP+ and AQP4+ astrocytes. Data from 3 biological replicates (n = 60 images). Unpaired t test and Mann–Whitney test, respectively. *p < 0.05 and ****p < 0.0001. E Apoptotic assessment in week 4 mature astrocytes stained with cleaved caspase 3. Violin plot from 3 biological replicates (n = 30 images) with outliers (Q = 0.1%) removed. F Secretome analysis of immature (d25/d + 0) and more mature (week 4) astrocytes. Mean ± s.e.m. of 3 biological replicates. G RNAseq reactive astrocyte gene expression profiling of week 4 mature astrocytes. See also Suppl. Figure 3–4, Additional file 2

