Fig. 6.
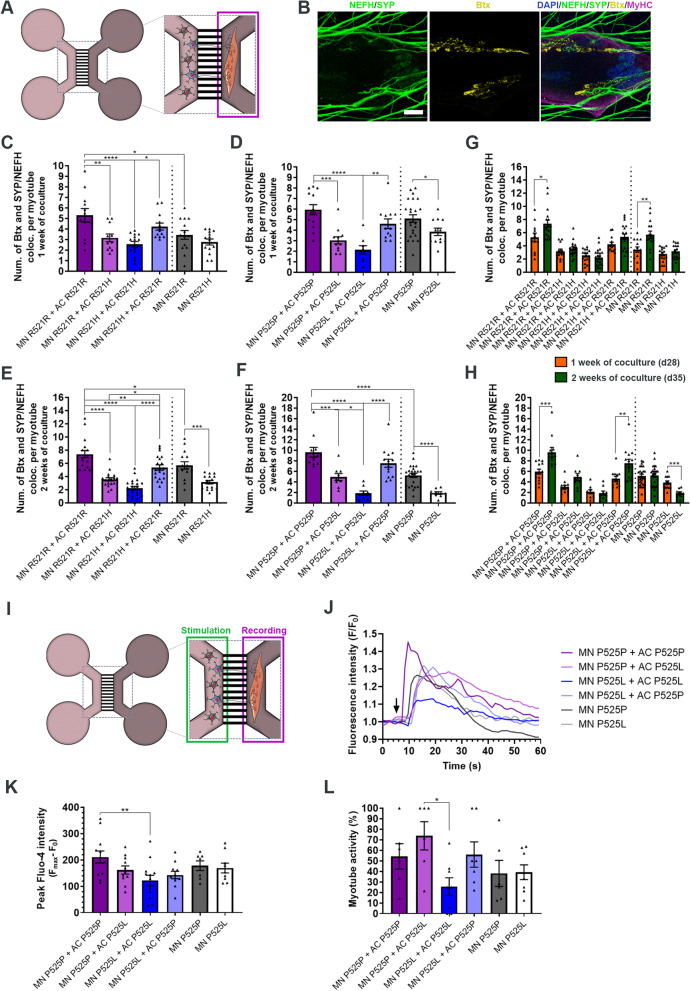
FUS-ALS astrocytes impair NMJ formation and functionality. A Experimental assessment was performed in the highlighted myotube compartment of the microfluidic device after 1 and 2 weeks of coculture between motor neurons (MN) and astrocytes (AC). B Confocal image example of an NMJ. NMJs were identified through colocalisation between motor neuron (NEFH) and presynaptic (SYP) markers with postsynaptic AChR marker (Btx) on MyHC-stained myotubes. Scale bar: 20 μm. C-F Quantification of the number of NMJs per myotube after 1 week (panel C-D) and 2 weeks (panel E–F) of cocultures between motor neuron/myotubes and astrocytes. G-H Number of NMJ formations over time. Graphs in panel C-H show mean ± s.e.m. of 3 biological replicates. One-way ANOVA with Tukey’s multiple comparisons test (panel C-F) and unpaired t test (panel G-H). *p < 0.05, **p < 0.01, ***p < 0.001 and ****p < 0.0001. I Schematic overview of live-cell calcium recordings to assess NMJ functionality. The motor neuron/astrocyte compartment was stimulated with 50 mM KCl to evoke an intracellular response, after which an influx in calcium was recorded in myotubes labelled with calcium-sensitive Fluo-4 dye. J Representative calcium influx curves in myotubes after KCl stimulation (arrow). K Quantifications of peak Fluo-4 intensity. Outliers (Q = 1%) removed. L Percentage of NMJ-excitable myotubes of total active myotubes. Data in (K and L) represent mean ± s.e.m. of 4–5 biological replicates with 2 technical replicates in each experiment. One-way ANOVA with Tukey’s multiple comparisons test. *p < 0.05 and **p < 0.01. Cell illustrations are modified from Smart Servier Medical Art licensed under a Creative Commons Attribution 3.0 Unported License (https://creativecommons.org/licenses/by/3.0/). See also Suppl. Figure 7–8, Additional file 2, as well as Additional files 7, 8, 9, 10, 11, 12 and 13

