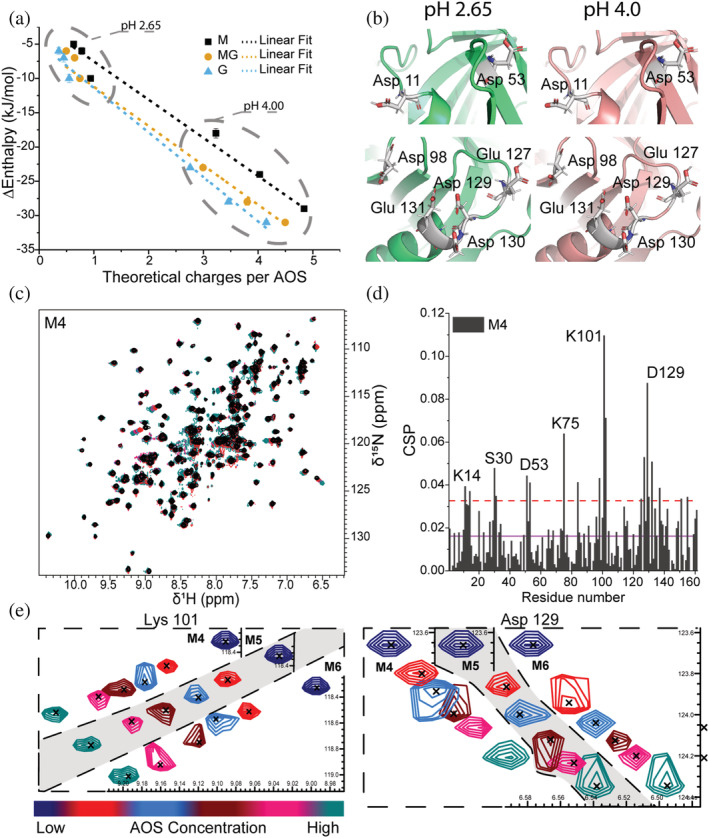
FIGURE 2.

Details of AOSs binding to β‐LgA. (a) Changes in enthalpy determined by ITC plotted against the theoretical number of charges on the AOSs at pH 2.65 and pH 4.00. The number of charges was calculated using pKa values of monomeric mannuronate or guluronate. Linear curves (dashed lines) were fitted to the data to visualize correlation (R 2 = 0.99). (b) Zoom on acidic residues of sites 1 (top) and 4 (bottom) changing protonation state depending on pH. β‐LgA backbone is shown in green (pH 2.65) and pink (pH 4.00); side chains are gray. (c) Overlay of 1H,15N‐HSQC spectra of β‐LgA titrated by 0–10 mM M4 at pH 2.65 and 37°C. (d) Chemical shift perturbations of β‐LgA per residue induced by addition of 10 mM M4. The purple line represents the average CSP, the dashed red line CSP_AVG + 1SD. (e) Changes in peak positions of Lys101 and Asp129 of site 4 upon titration with M4, M5 or M6
