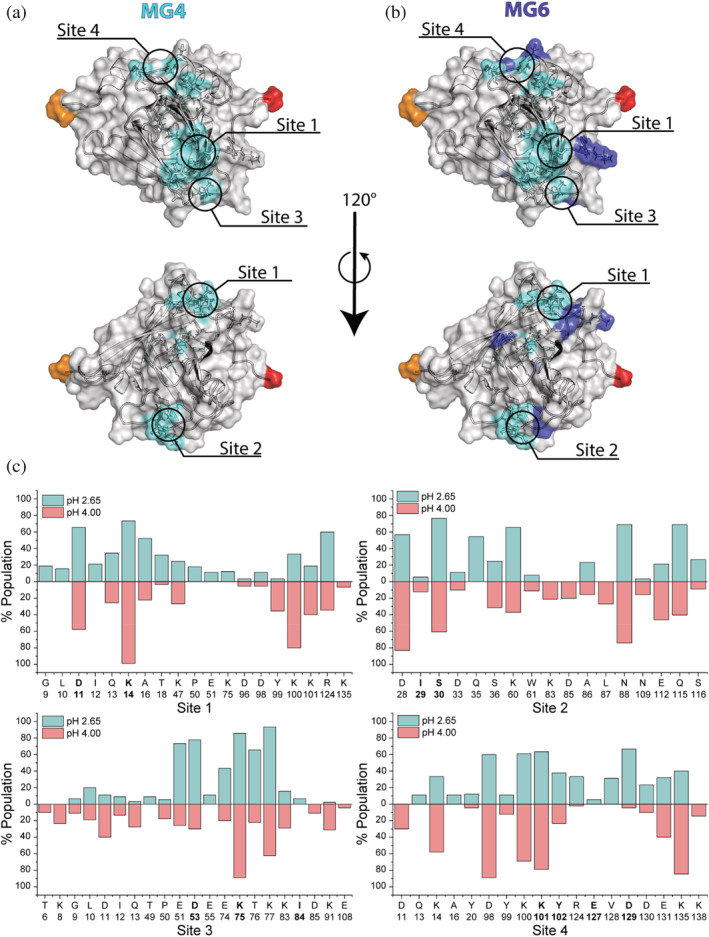
FIGURE 3.

Binding sites on β‐LgA. Residues perturbed by MG AOSs (CSP > AVG + 1SD) identifying the binding sites on β‐LgA (RCSB: 1DV9 1) shown in transparent surface representation. (a) Residues perturbed by MG4 (nITC = 5) are colored cyan. (b) Residues perturbed by MG6 (nITC = 2) are colored dark blue. N‐ and C‐terminal residues are colored in red and orange, respectively, unaffected surface is gray. (c) Population percent of β‐LgA residues found to interact with AOSs by molecular docking simulation at either pH 2.65 (light blue) or pH 4.00 (light red) for each of the NMR determined sites (bold letters)
