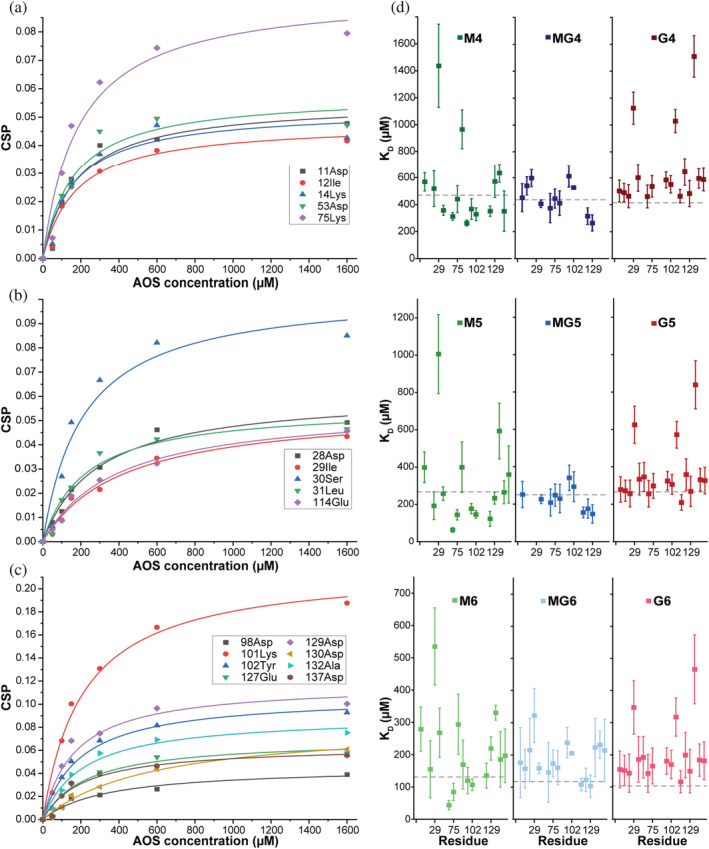
FIGURE 4.

Affinity determination of individual sites from CSPs. NMR CSPs of 15 N‐β‐LgA (200 μM) titrated with AOS (1.6, 3.75, and 10 mM for DP 6, 5, and 4, respectively) as a function of ligand concentration. CPS induced by M6 are fitted to a hyperbolic binding curve to obtain KD for residues with CSP > AVG + 1SD. (a) Sites 1 + 3, (b) site 2, (c) site 4. (d) KD values of individual residues with CSP > AVG + 1SD extracted from NMR (Figure S3). Gray dotted lines correspond to global KD values determined by ITC
