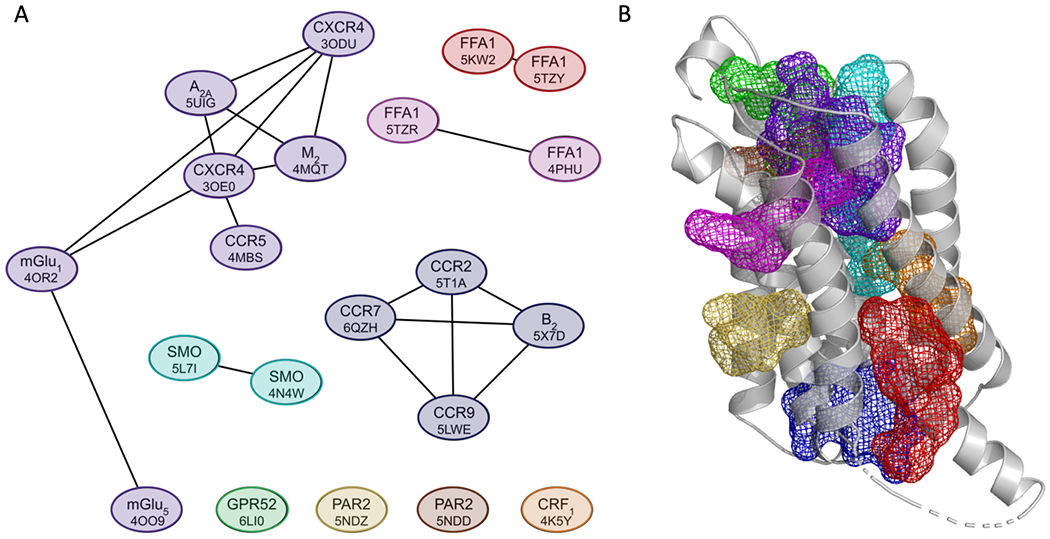
Figure 2.

Locations of allosteric sites in structures co-crystallized with ligands. A. Similarity based clustering of the allosteric sites in the 21 structures with bound ligands and strong hot spots. The length of the edges connecting the nodes represents the level of similarity based on the measure of probe overlap, with smaller distances indicating higher numbers of overlapping probes. As shown, the 21 sites map to 9 consensus locations. B. The 9 consensus binding sites defined by the clusters shown in A. The color coding of the mesh representations is as follows: purple – Cluster 1 (3ODU, 4MQT, 4MBS, 5UIG, 3OE0, 4OR2, and 4OO9); blue – Cluster 2 (5T1A, 6QZH, 5LWE and 5X7D); cyan – Cluster 3 (5L7I and 4N4W); pink – Cluster 4 (5TZR and 4PHU); red – Cluster 5 (5KW2 and 5TZY); orange - 4K5Y; green - 6LI0; yellow - 5NDZ; and brown - 5NDD.
