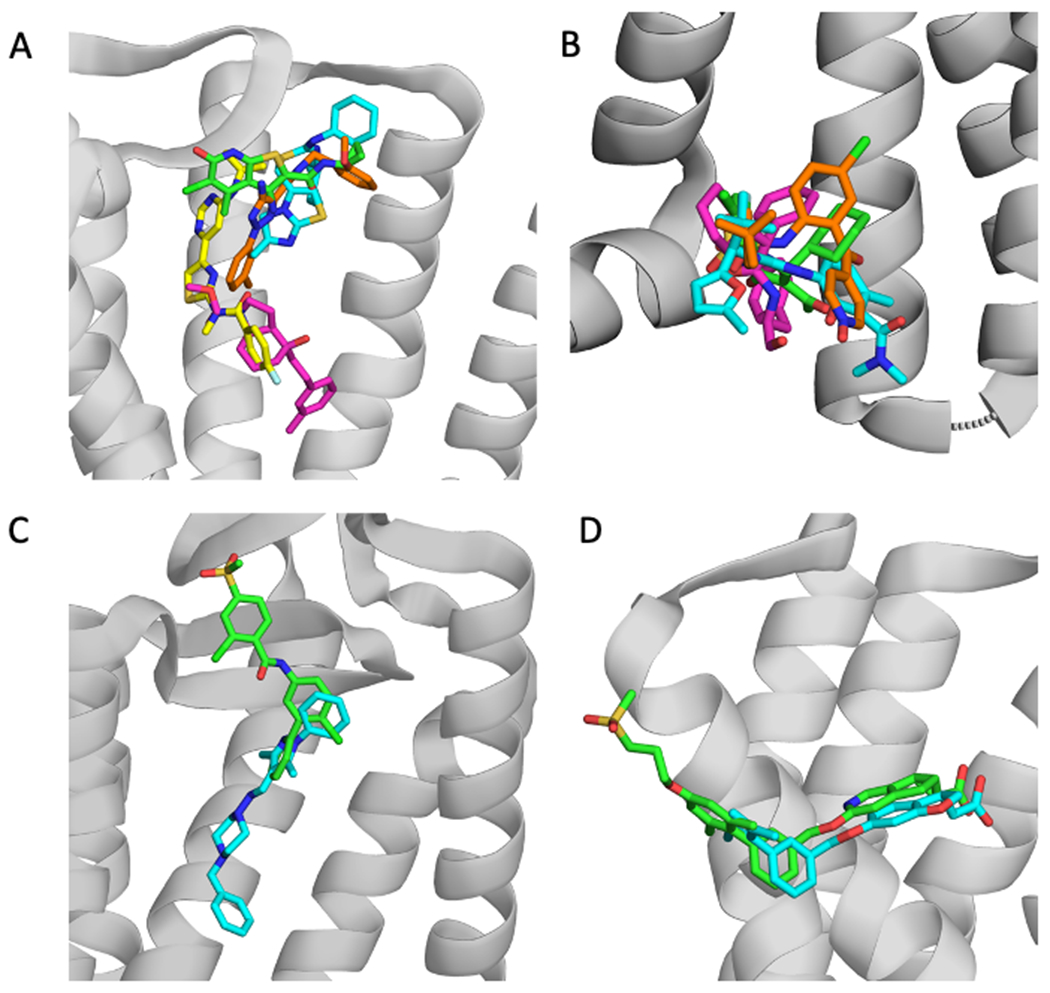
Figure 3.

Examples of allosteric ligand clusters. PDB IDs are shown in parenthesis. A. Cluster 1: 2CU green (4MQT), ITD cyan (3ODU); FM9 yellow (4OR2), 8D1 orange (5UIG), 2U8 pink (4OO9). The grey cartoon represents the protein structure 4MQT. B. Cluster 2: VT5 green (5T1A), 8VS pink (5X7D), JLW cyan (6QZH), and 79K orange (5LWE). The cartoon shows the protein structure 5T1A. C. Cluster 3: VIS (5L7I) green, and SNT (4N4W) cyan. The cartoon shows the protein structure 5L7I. D. Cluster 4: MK6 green (5TZR), and 2YB cyan (4PHU). The protein structure shown is 5TZR.
