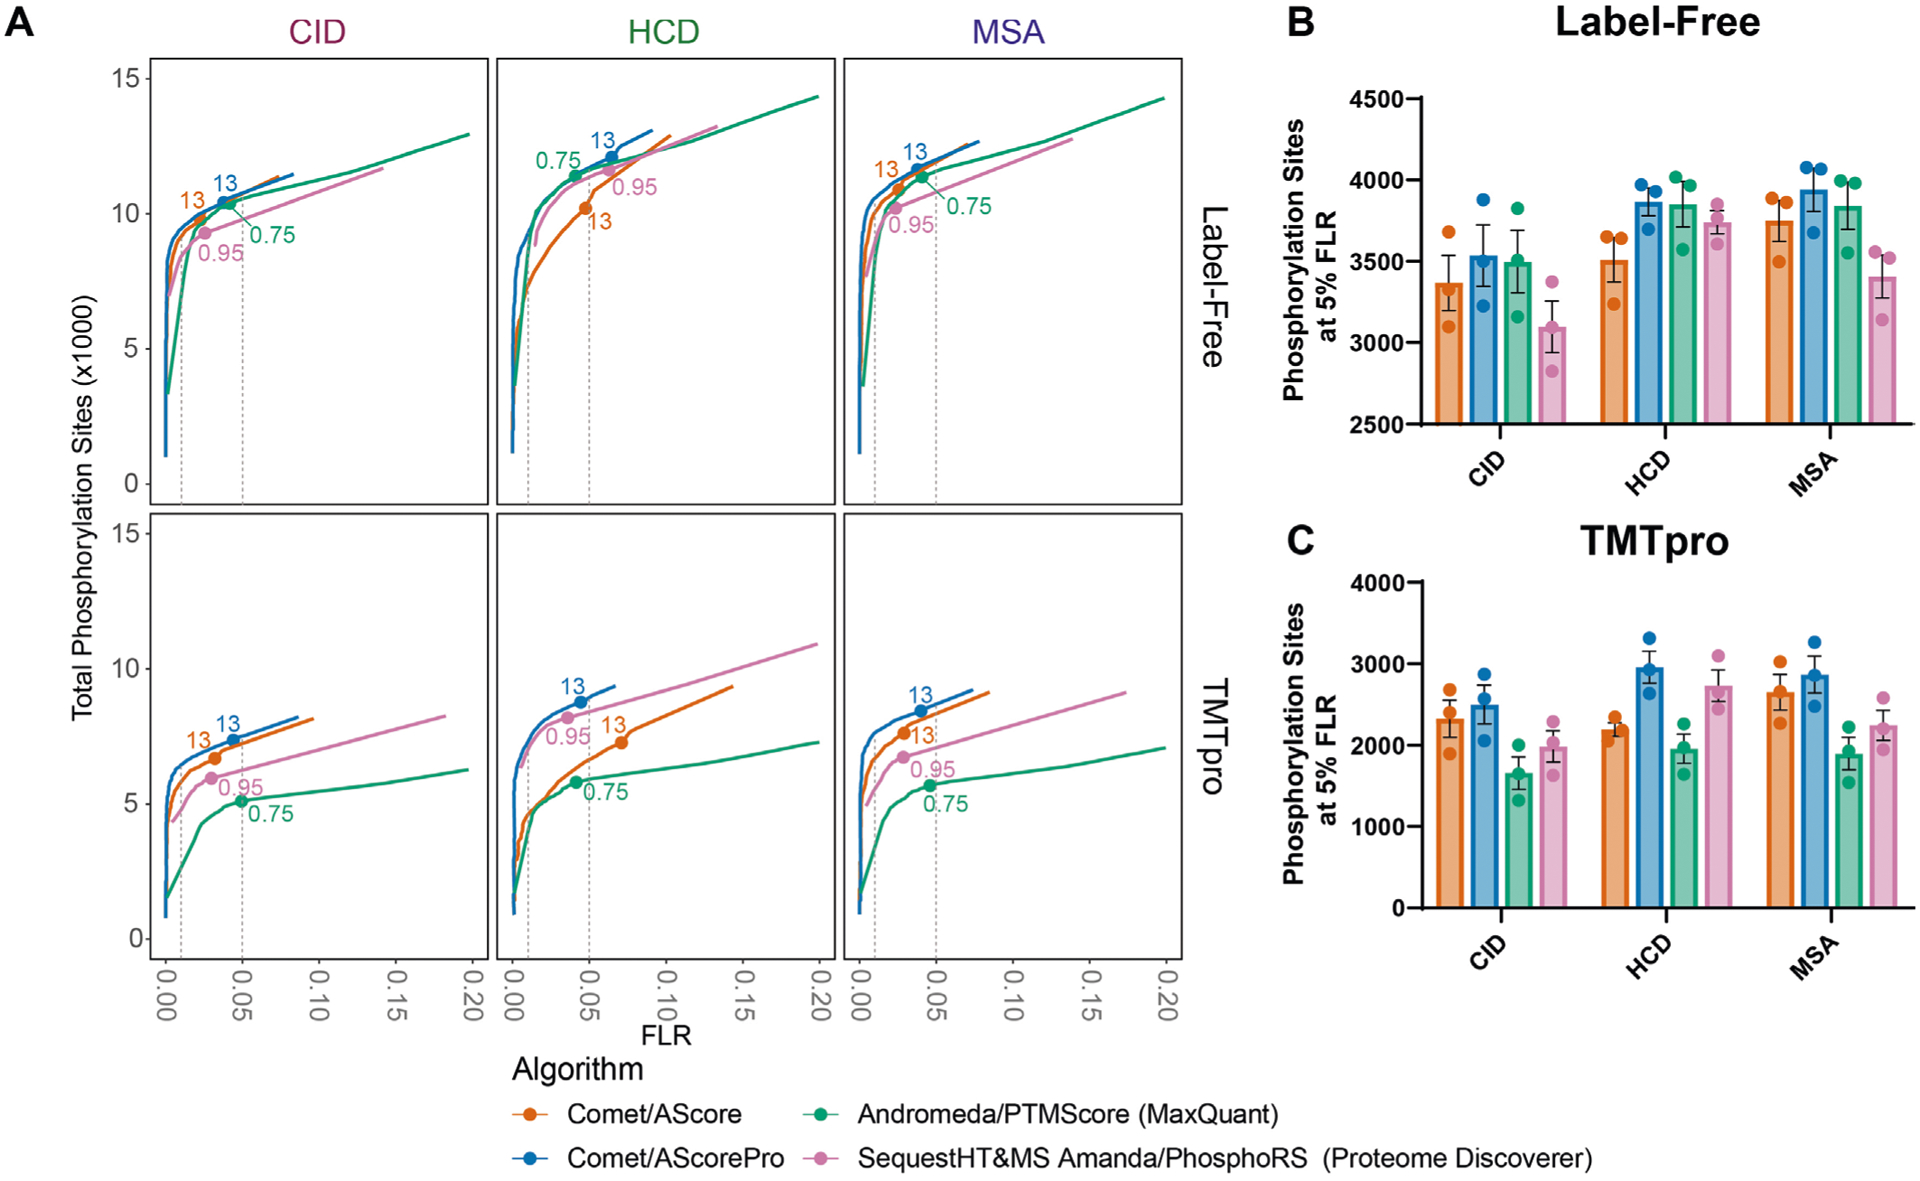
Extended Data Fig. 1 |. Using the iSPI to compare phosphoproteomics pipelines.

The datasets for the three subpools were analyzed using four different pipelines. Each pipeline included a database searching algorithm and a site localization tool. a) Similar to Fig. 2, receiver operating curves are shown displaying the number of combined sites from the three pools on the y-axis as a function of the FLR on the x-axis. Vertical grey dotted lines represent empirical FLR’s of 0.01 and 0.05 respectively. Labelled points represent commonly used localization cutoffs: 13 for AScore and AScorePro, 0.75 localization probability for MaxQuant, and 0.95 site probability for proteome discoverer. At an empirical FLR of 0.05, differences are apparent. b) The number of phosphorylation sites per pool is shown for label free peptides at an empirical 5% FLR. c) The number of phosphorylation sites per pool is shown for TMTpro-labeled peptides at an empirical 5% FLR. Bar represents the mean. Error bars represent the standard error of the mean for n = 3 subpools.
