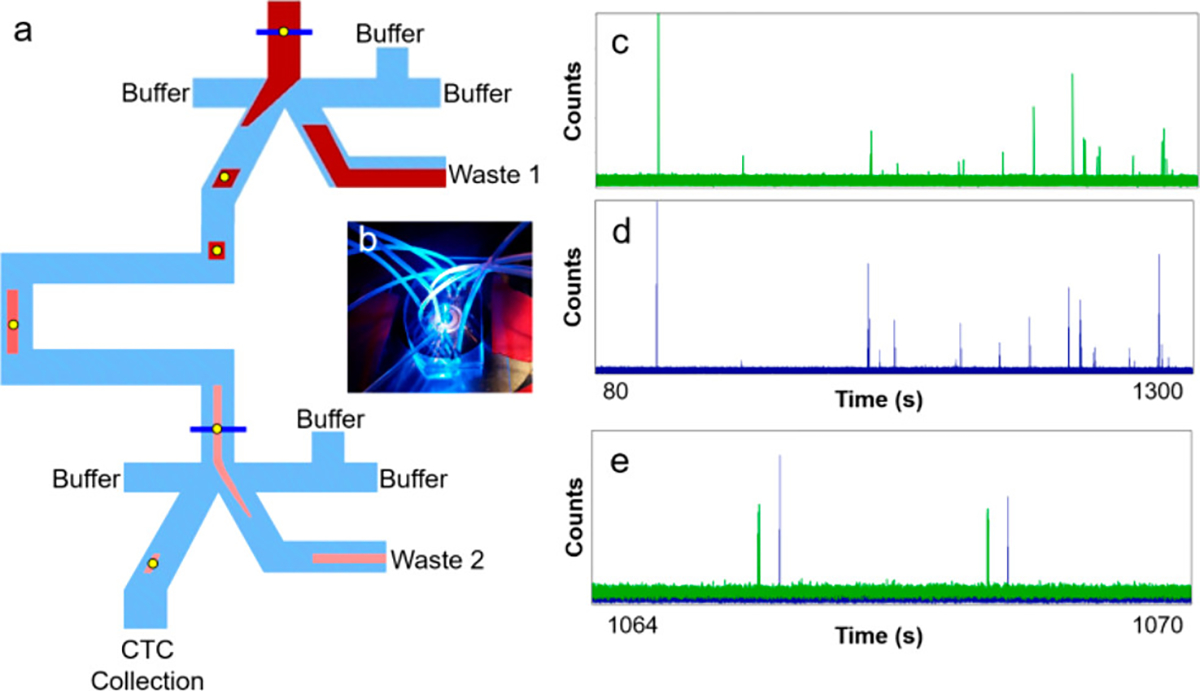
Figure 1.

(a) Schematic of sequential eDAR chip. Blood is loaded at the inlet (top) and CTCs are detected at two detection lines (blue) using laser-induced fluorescence. CTC-detection signals trigger sorting at two junctions by activating a solenoid and increasing the pressure of flow from the right side of the junction, causing the aliquot to flow to the left. After the first junction, the aliquot passes down a channel to the second detection line, after which it is sorted for a second time. The aliquot is stretched in the channel between two junctions, resulting in fewer contaminating blood cells. Most blood cells are sent to waste (Wastes 1 and 2). (b) Image of a sequential eDAR chip while running a sample, mounted on a microscope and using 488 nm laser excitation. (c, d) APD traces from the first (c) and second (d) sorting junctions in a single run. (e) Overlay of enlarged section from 1064 to 1070 s from (c) and (d), showing sorting events at the first junction (green) followed by sorting events at the second junction (blue).
