
Fig. 3. Vascular territories and hemisphere asymmetry enhanced feature discrimination.
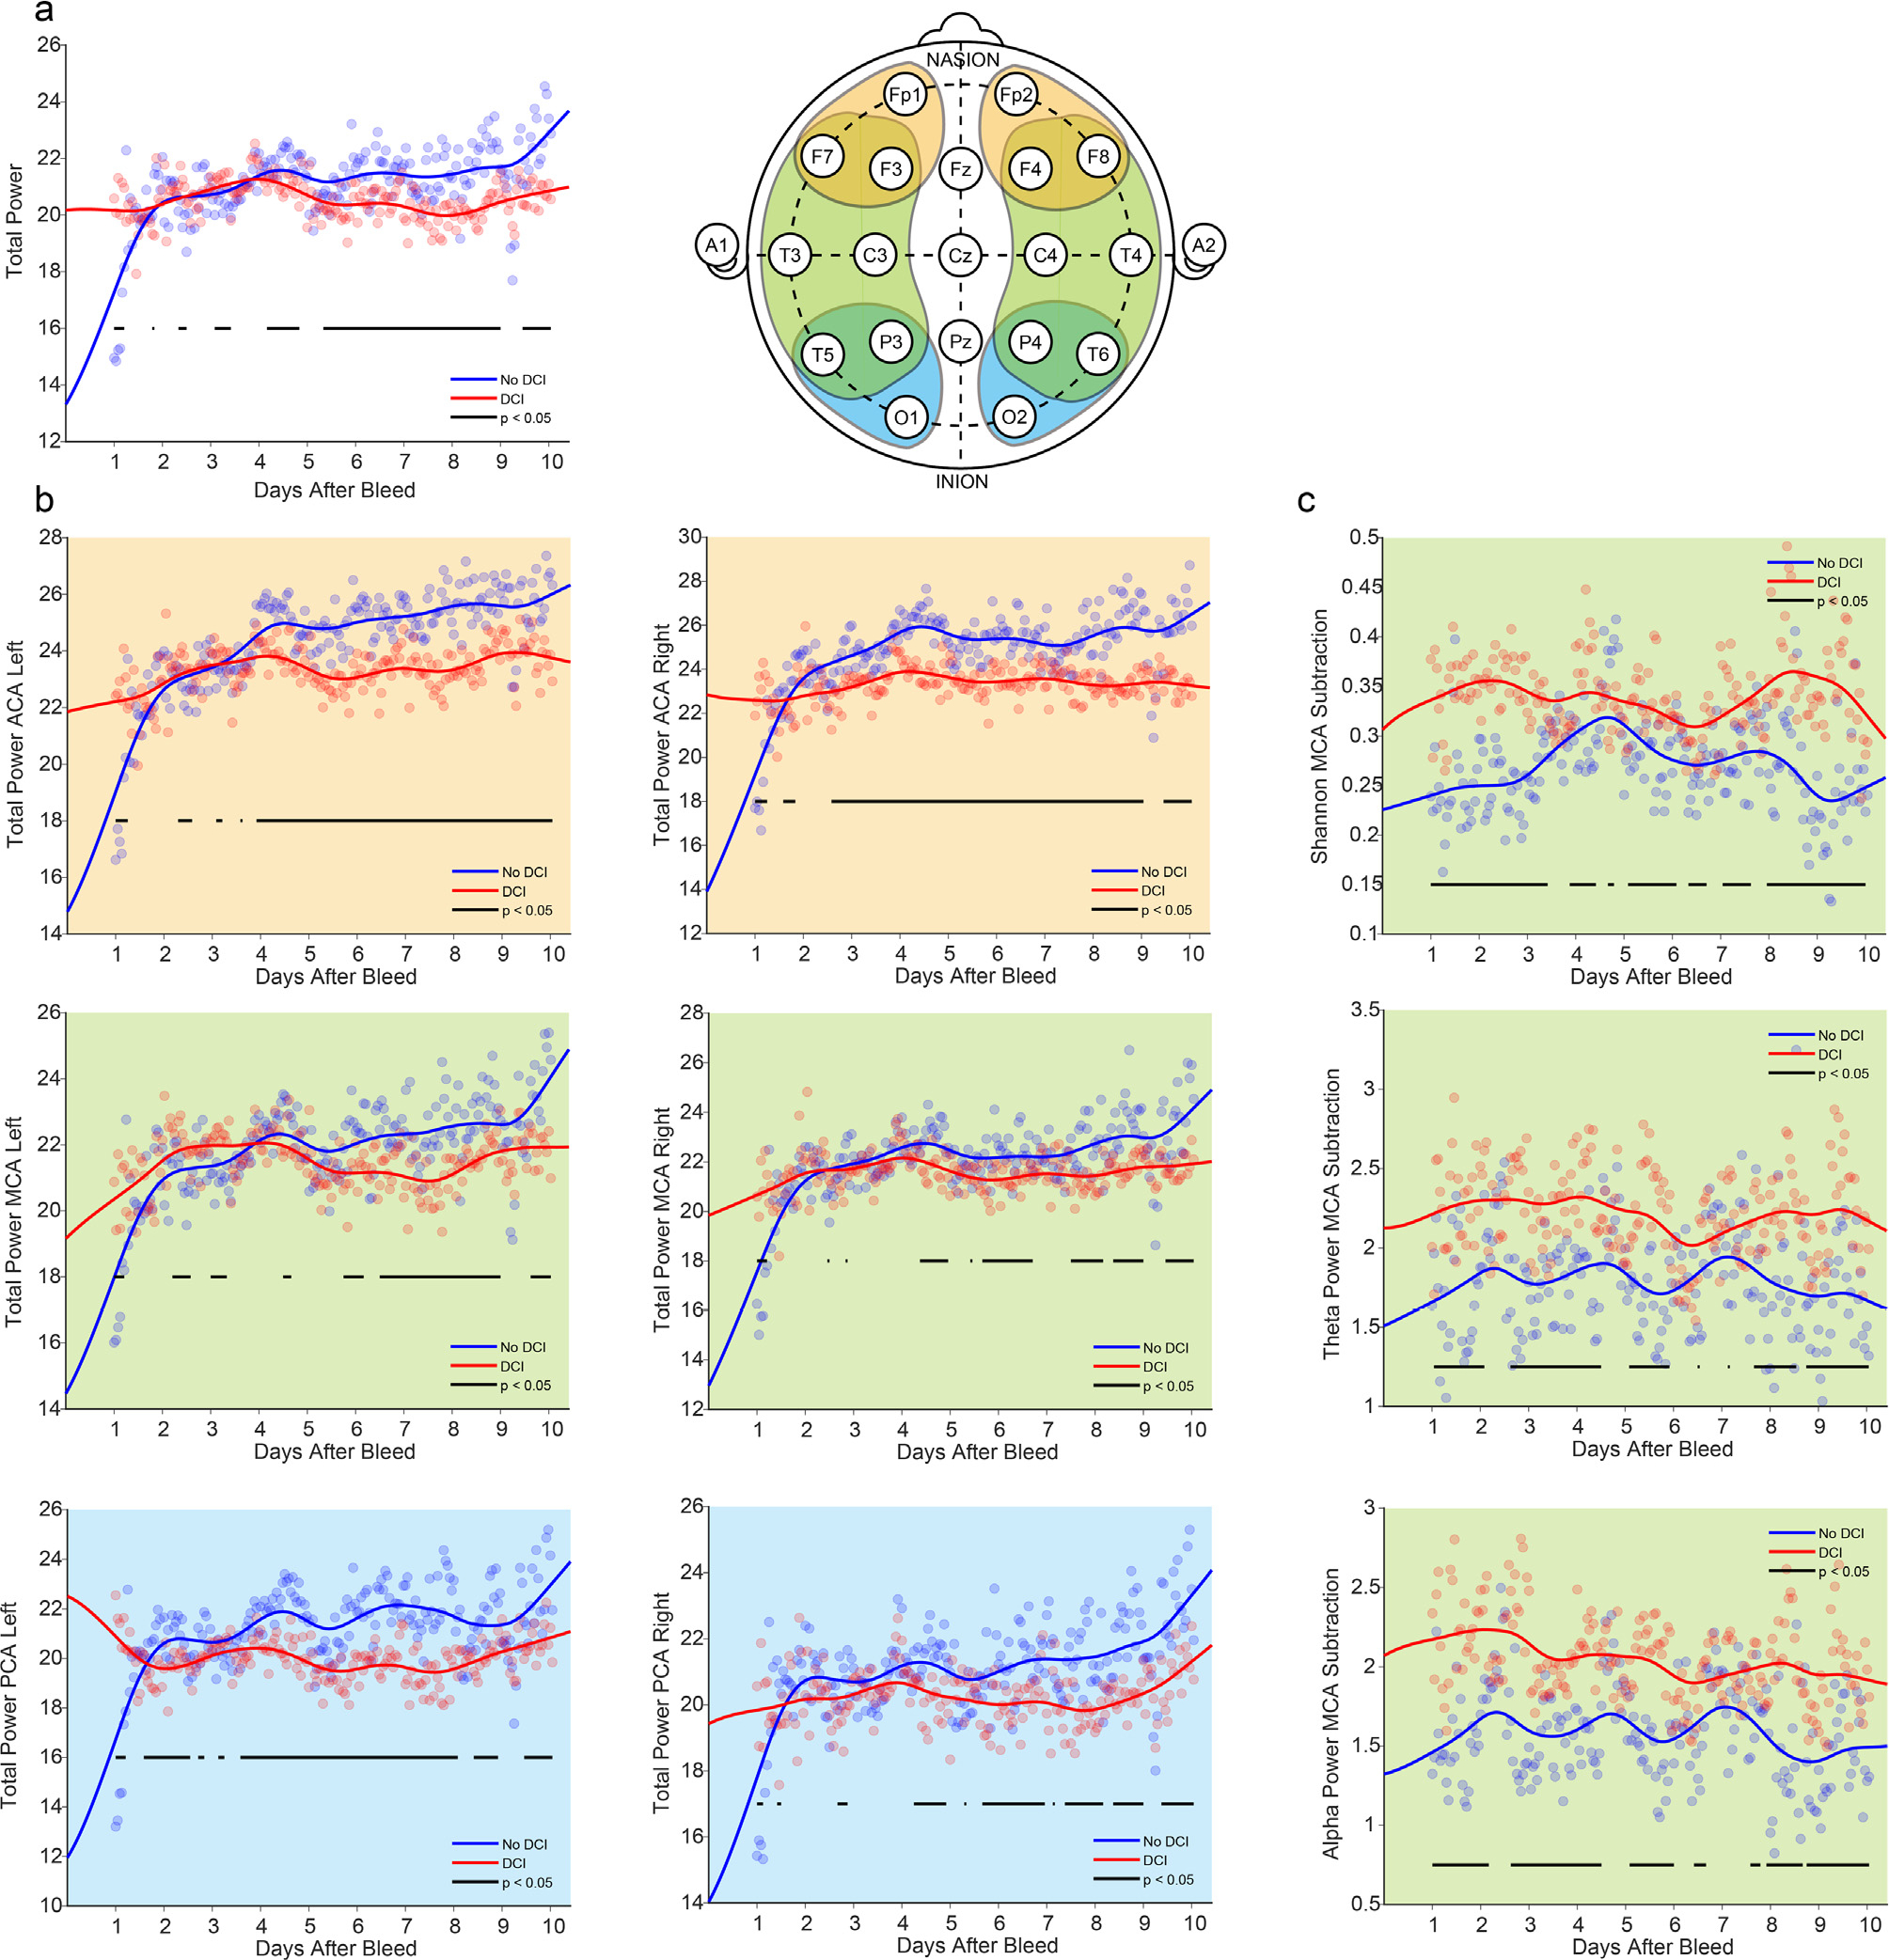
EEG electrodes were divided into their vascular territory representations (top right): anterior cerebral artery (ACA; orange), middle cerebral artery (MCA; green), and posterior cerebral artery (PCA; blue). Fitted trends of each feature are shown in delayed cerebral ischemia (DCI; red) and no DCI (blue) patients. a, total power based on the whole-brain averages, b, total power based on six vascular territories: ACA (orange background), MCA (green background), and PCA (blue background) of left and right hemispheres (from left to right). c, hemisphere asymmetry of MCA (green background) in Shannon entropy, theta power, and alpha power (from top to bottom). EEG features were aligned to subarachnoid hemorrhage (SAH) time. The bars below the mean curves indicate statistical significance (t-test, p < 0.05). The statistical significance was evaluated for each four-hour time interval.