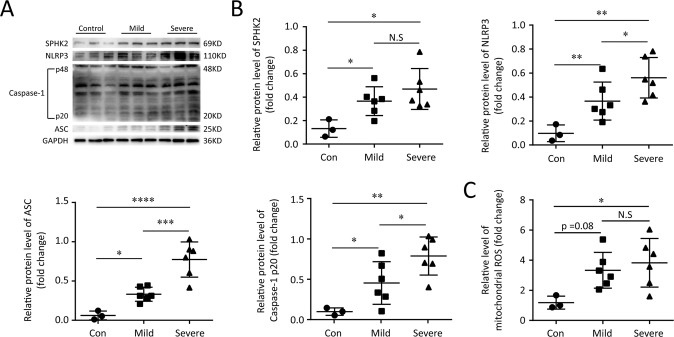
Fig. 1. SPHK2, NLRP3 and mtROS facilitate ARDS progression.
A Electrophoresis bands of SPHK2, NLRP3, Caspase-1, and ASC from lysates of PBMCs in different groups. GAPDH acted as an internal reference. B Protein levels quantified by densitometry using Image J software were shown as bar graphs. C mtROS levels were measured in supernatant lysates of PBMCs from subjects. Data were expressed as mean ± SEM of at least three independent experiments. *p < 0.05; **p < 0.01; ***p < 0.005; ****p < 0.001; N.S., not significant.

