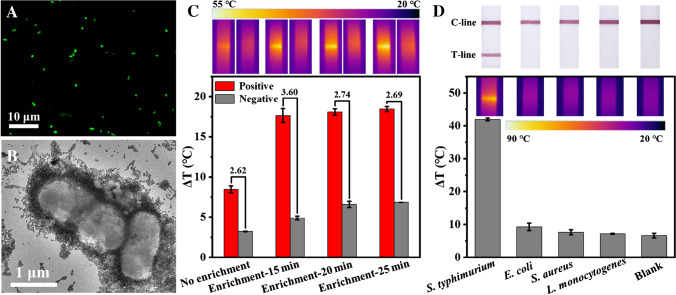
Fig. 3.
A–B Fluorescence microscopic image and TEM image of S. typhimurium captured by Au-Fe3O4-Ab. C Photothermal signals obtained from positive samples (1 × 10⁷ CFU/mL S. typhimurium) and blank samples enriched by different magnetic attraction times. The lower is the histogram of photothermal signals, the upper are the corresponding photothermal images. The numbers above the columns are the signal-to-noise ratios. D Results from detection of different bacteria (5 × 10⁷ CFU/mL). The lower is the photothermal signal histogram and images of the test strips, the upper are the corresponding photographs by phones. Error bars are calculated from three experiments

