
Fig. 4.
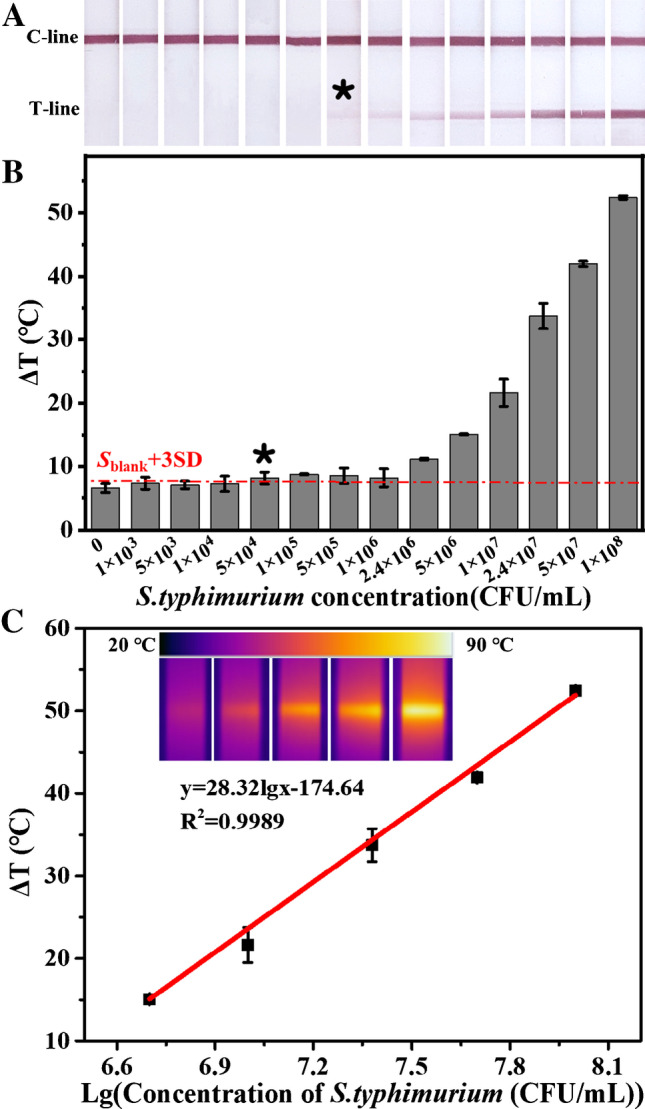
A–B Photographs of the test strips and the corresponding photothermal signals obtained from detection of different concentrations of S. typhimurium. The asterisk represents the detection limit. The red line represents the lowest distinguishable signal by photothermal measuring. C Calibration plot of photothermal signal versus S. typhimurium concentration. The insets are the corresponding photothermal images. Error bars are calculated from three experiments