Fig. 5.

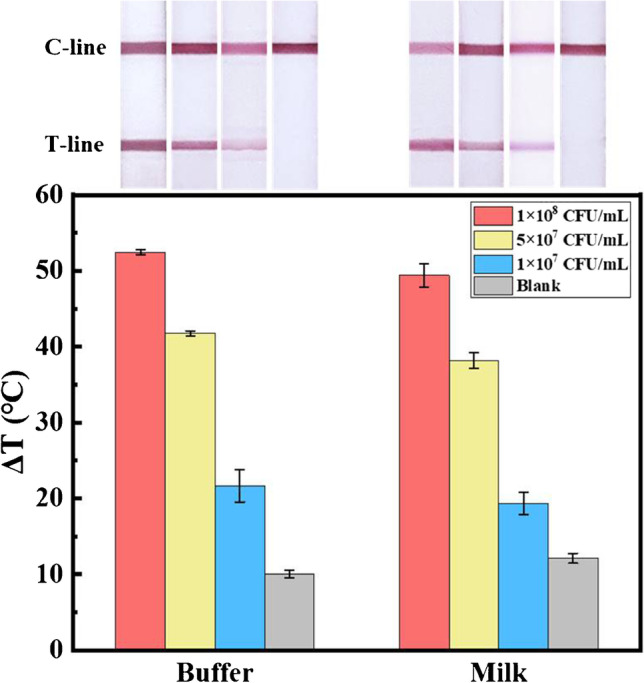
Photothermal signal histograms of the test strips and their corresponding photographs obtained from detecting different concentrations of S. typhimurium in buffer and milk samples. Error bars are calculated from three experiments

Photothermal signal histograms of the test strips and their corresponding photographs obtained from detecting different concentrations of S. typhimurium in buffer and milk samples. Error bars are calculated from three experiments