
Figure 1.
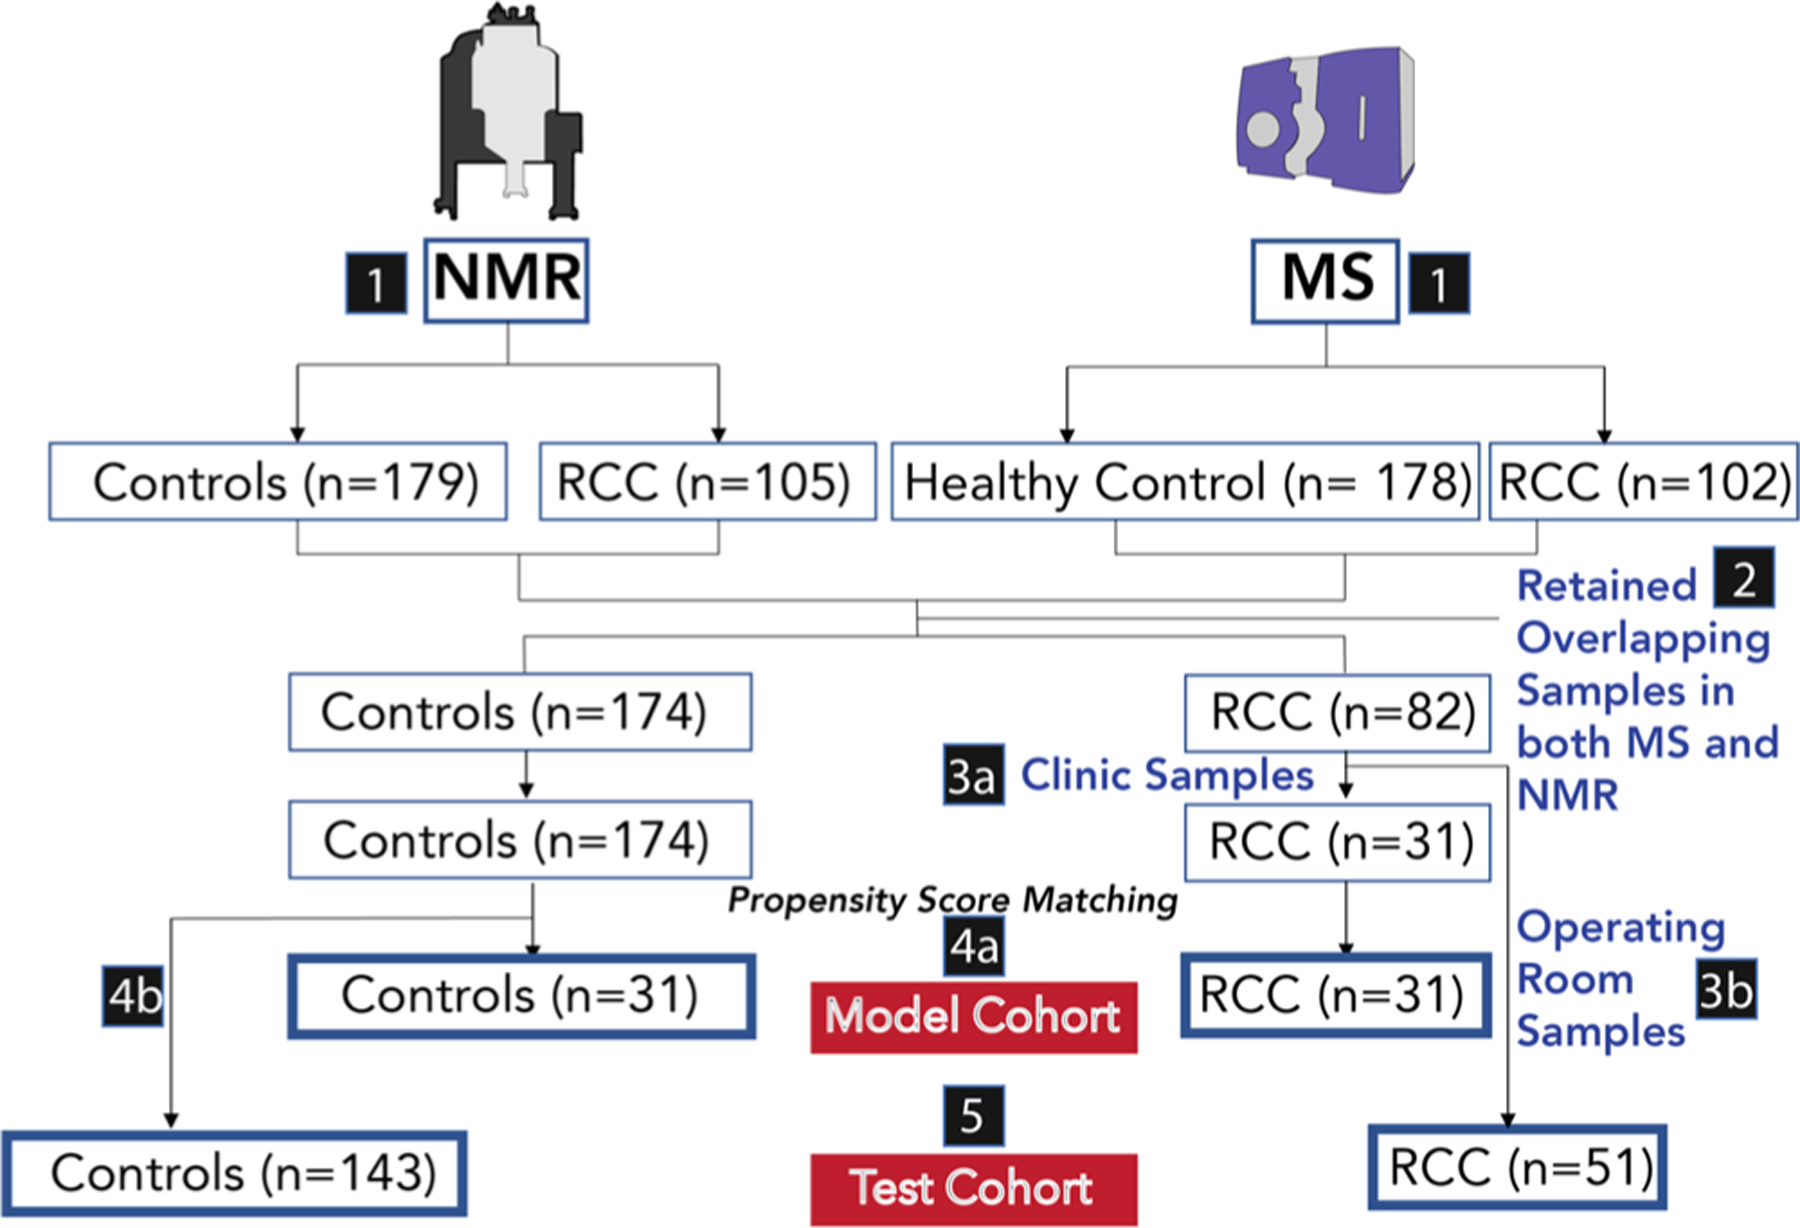
Flow chart for patient selection. Samples for which NMR and MS measurements were collected (1). A total of 284 samples, with 174 control individuals and 82 RCC patients, have their urine samples analyzed by both NMR and LC–MS methods (2). RCC samples collected in the clinic are selected for the model cohort (3a), while the operating room RCC samples are selected for the test cohort (3b). The model cohort was selected via propensity score matching from those samples collected in the clinic (31 RCC samples, 31 control samples) (4). The test cohort contained 51 RCC samples collected in the operating room and 143 controls collected in the clinic (5).