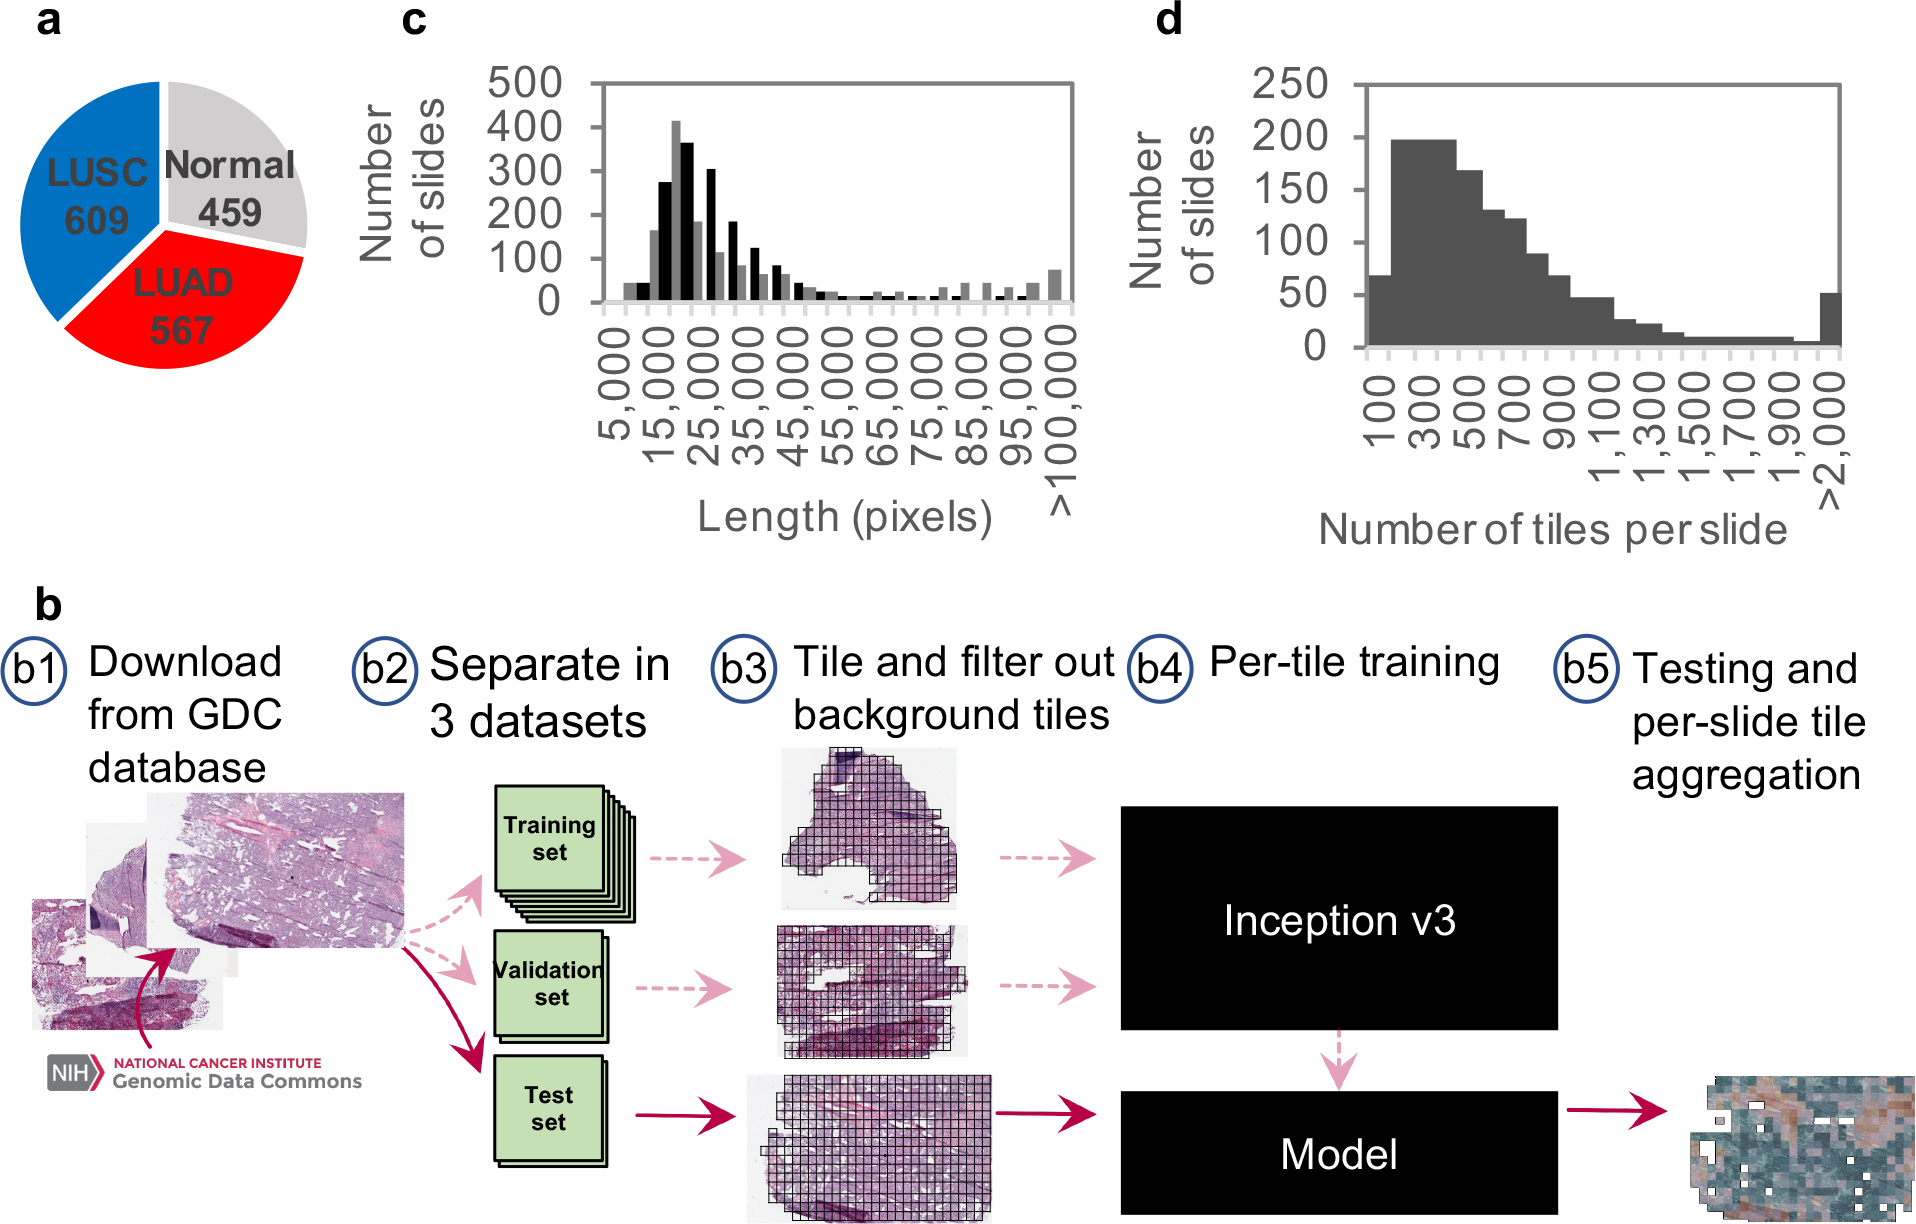
Figure 1. Data and strategy:

(a) Number of whole-slide images per class. (b) Strategy: (b1) Images of lung cancer tissues were first downloaded from the Genomic Data Common database; (b2) slides were then separated into a training (70%), a validation (15%) and a test set (15%); (b3) slides were tiled by non-overlapping 512×512 pixels windows, omitting those with over 50% background; (b4) the Inception v3 architecture was used and partially or fully re-trained using the training and validation tiles; (b5) classifications were performed on tiles from an independent test set and the results were finally aggregated per slide to extract the heatmaps and the AUC statistics. (c) Size distribution of the images widths (gray) and heights (black). (d) Distribution of the number of tiles per slide.
