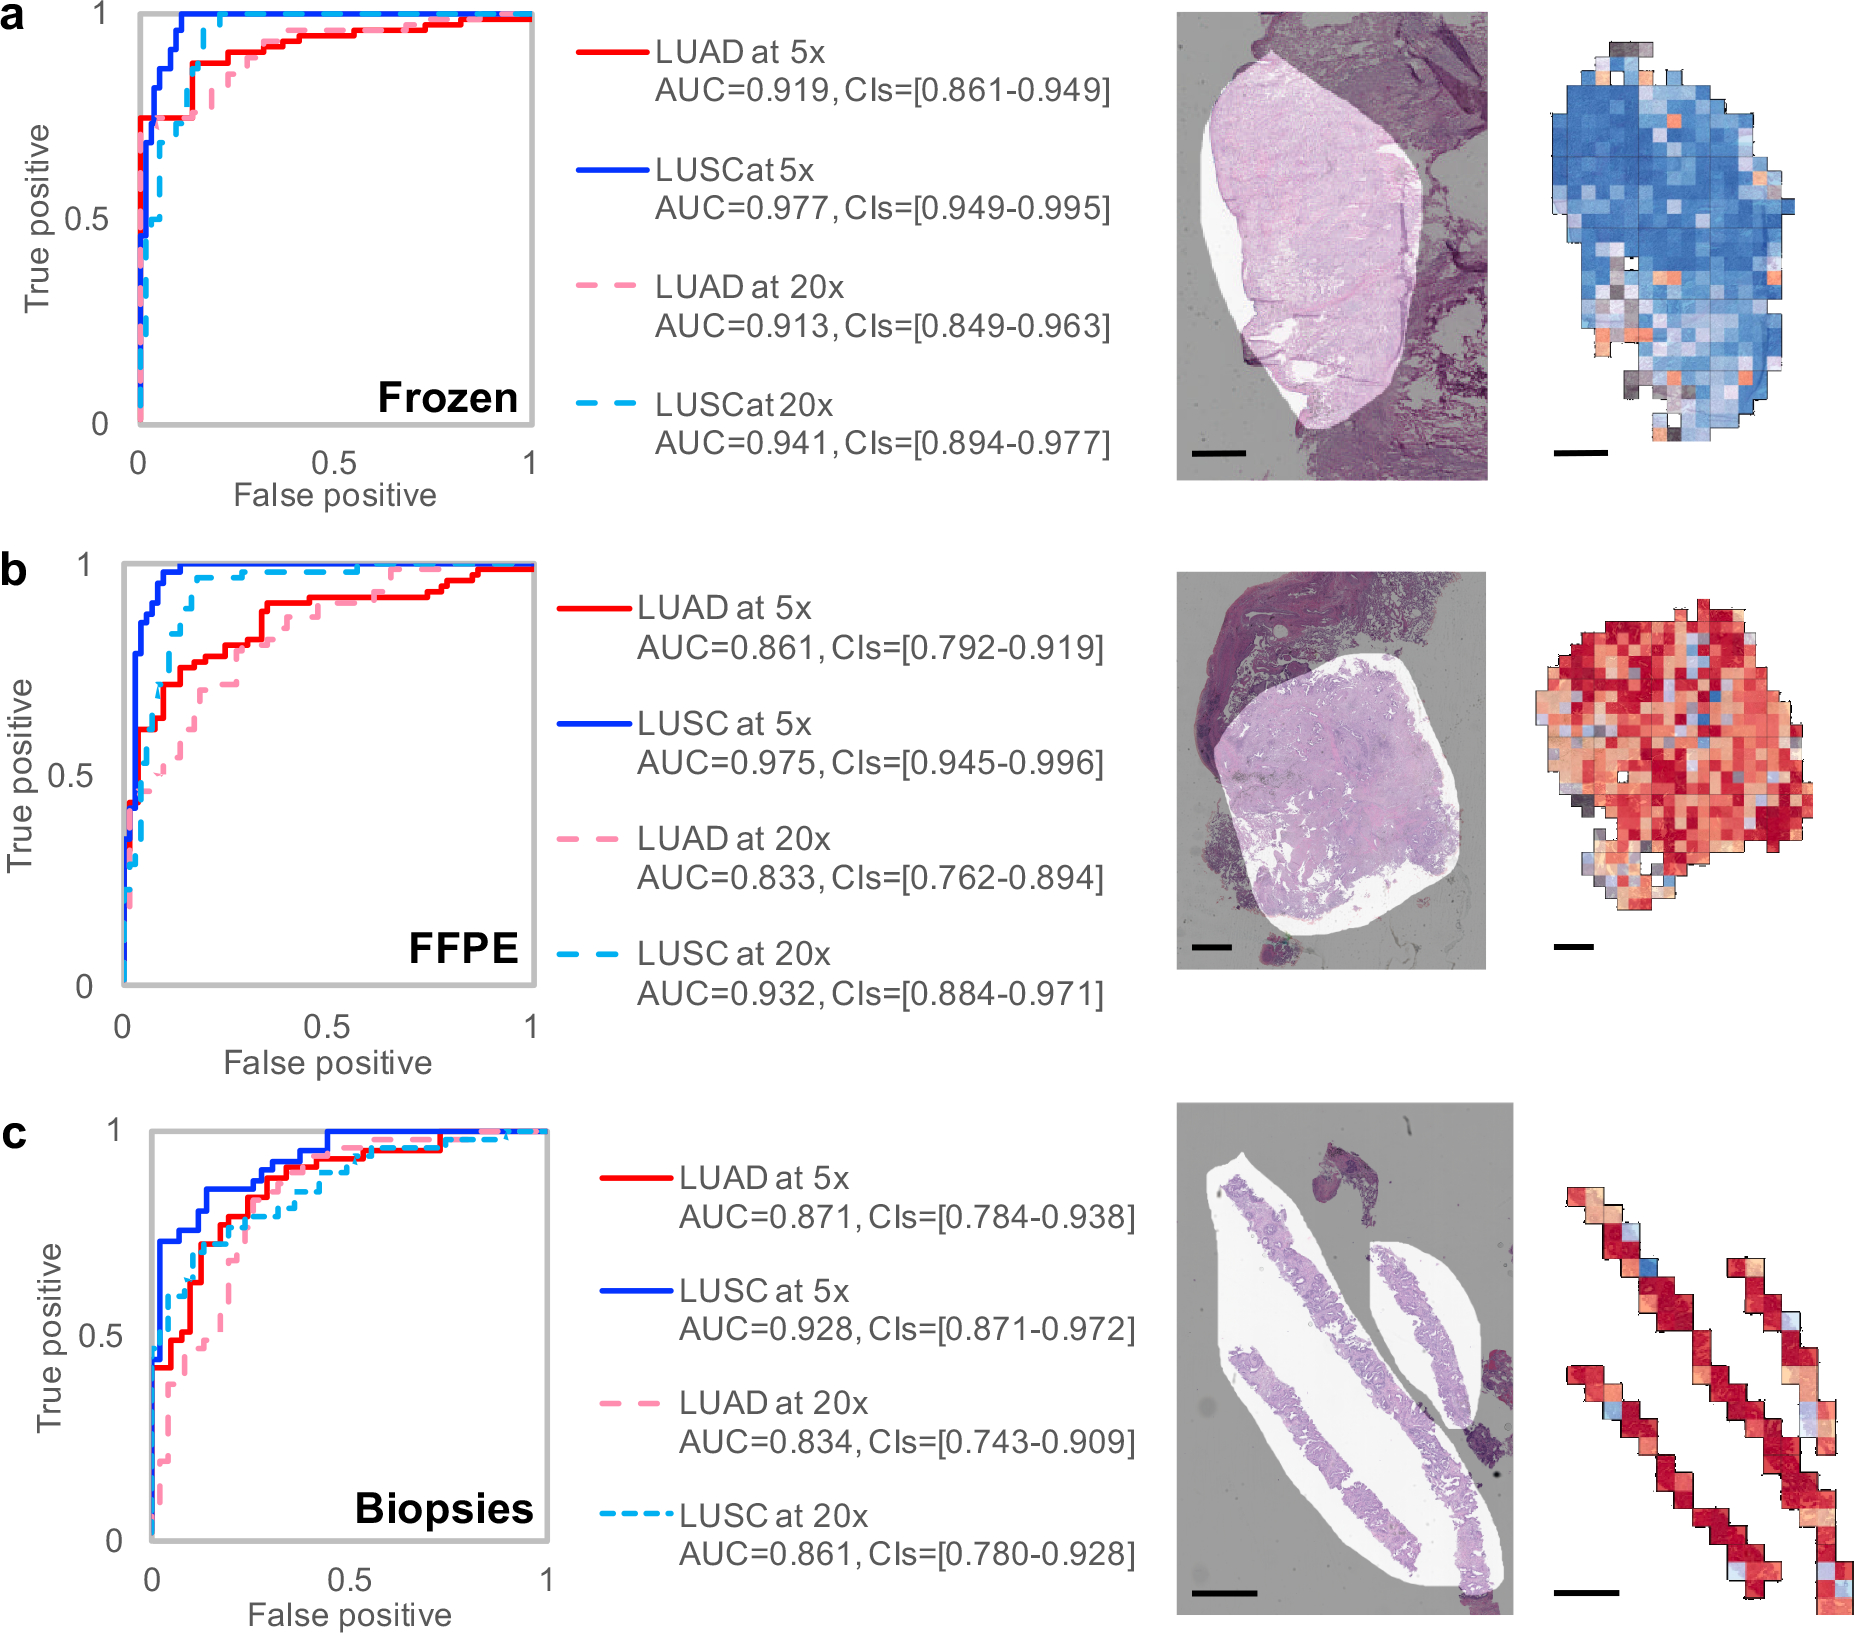
Figure 2. Classification of presence and type of tumor on alternative cohorts:

Receiver Operating Characteristic (ROC) curves (left) from tests on (a) frozen sections (n=98 biologically independent slides), (b) formalin-fixed paraffin-embedded (FFPE) sections (n=140 biologically independent slides) and (c) biopsies (n=102 biologically independent slides) from NYU Langone Medical Center. On the right of each plot, we show examples of raw images with an overlap in light grey of the mask generated by a pathologist and the corresponding heatmaps obtained with the three-way classifier. Scale bars are 1 mm.
