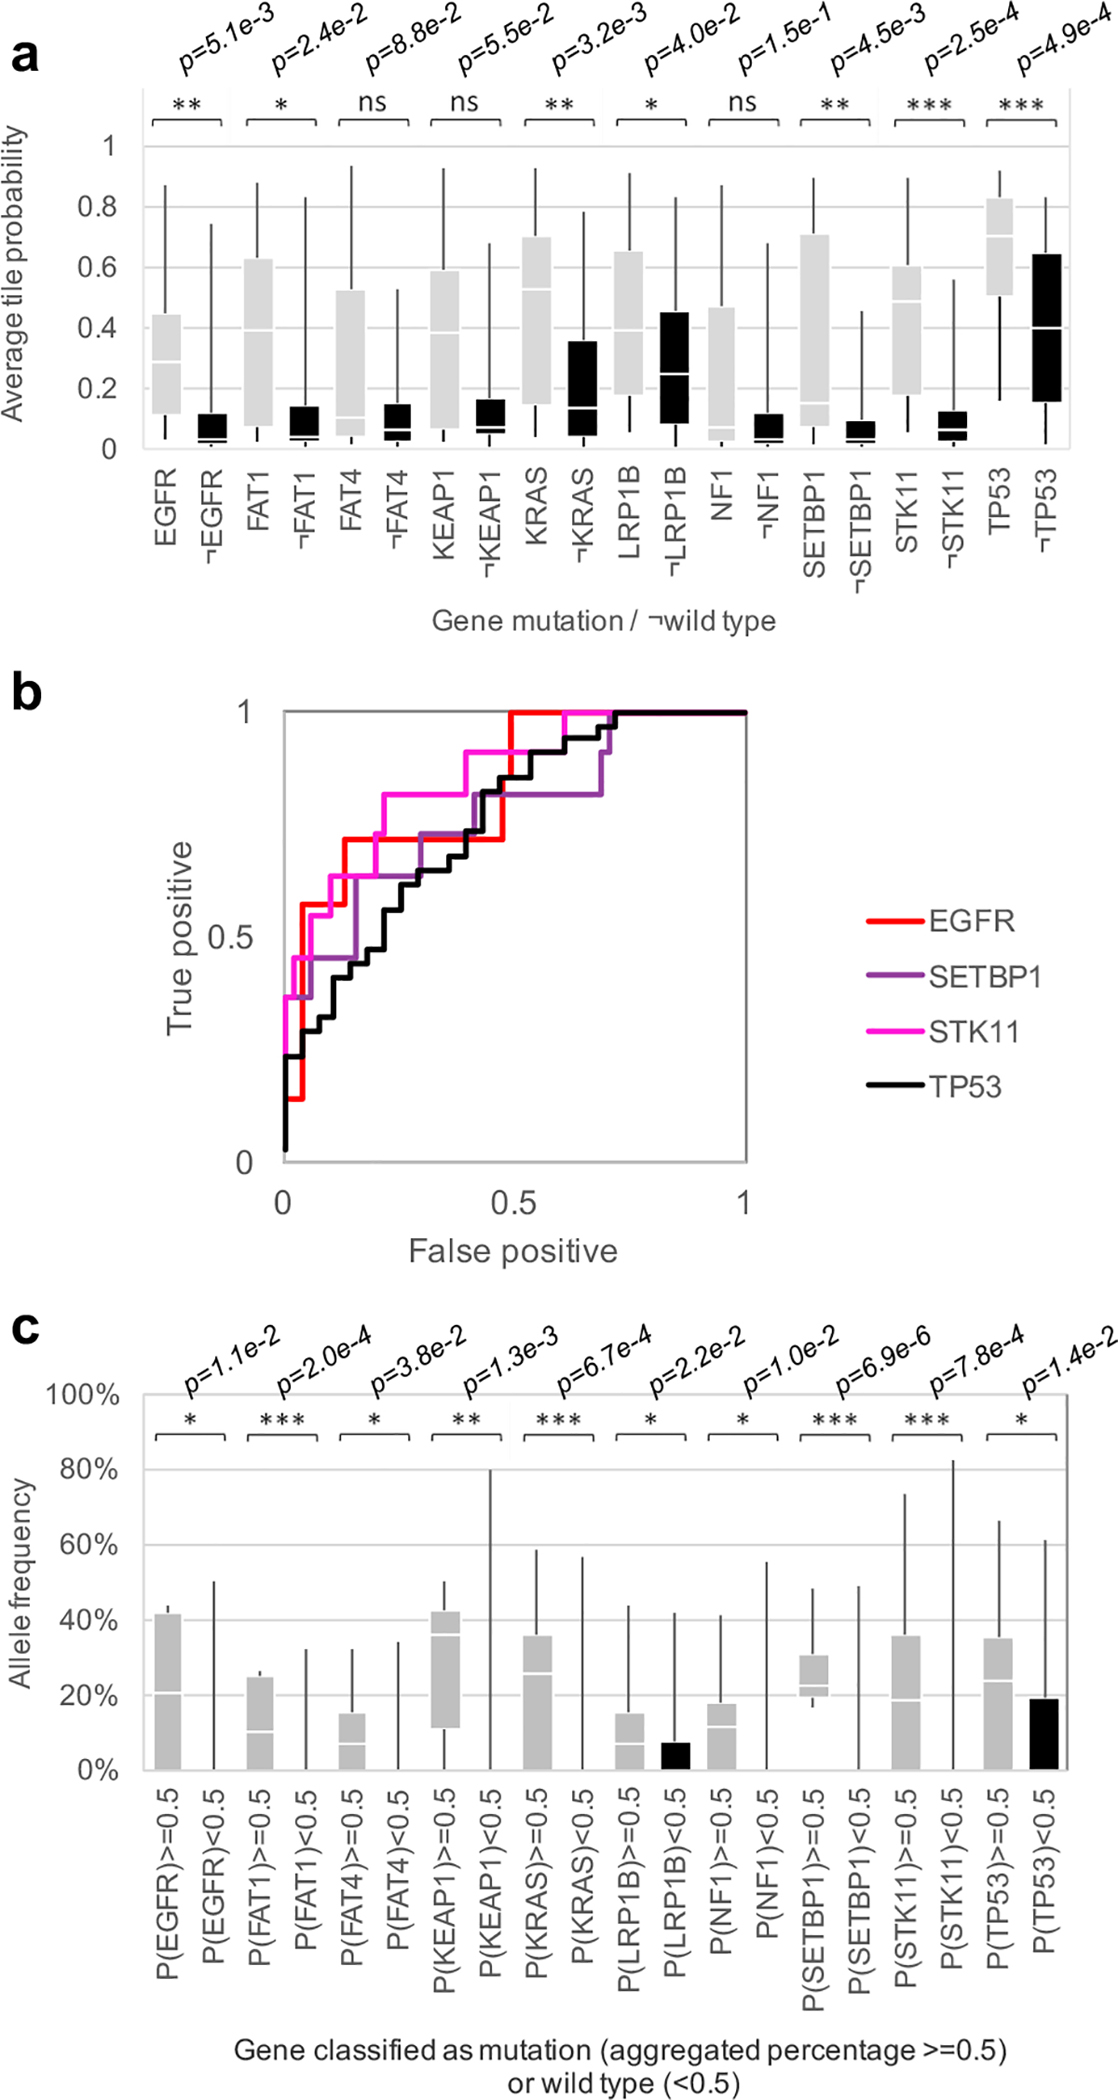
Figure 3. Gene mutation prediction from histopathology slides give promising results for at least 6 genes:

(a) Mutation probability distribution for slides where each mutation is present or absent (tile aggregation by averaging output probability). (b) ROC curves associated with the top four predictions (a). (c) Allele frequency as a function of slides classified by the deep learning network as having a certain gene mutation (P≥0.5), or the wild-type (P<0.5). p-values estimated with two-tailed Mann-Whitney U-test are shown as ns (p>0.05), * (p≤0.05), ** (p≤0.01) or *** (p≤0.001). For a, b and c, n=62 slides from 59 patients. For the two box plots, whiskers represent the minima and maxima. The middle line within the box represents the median.
