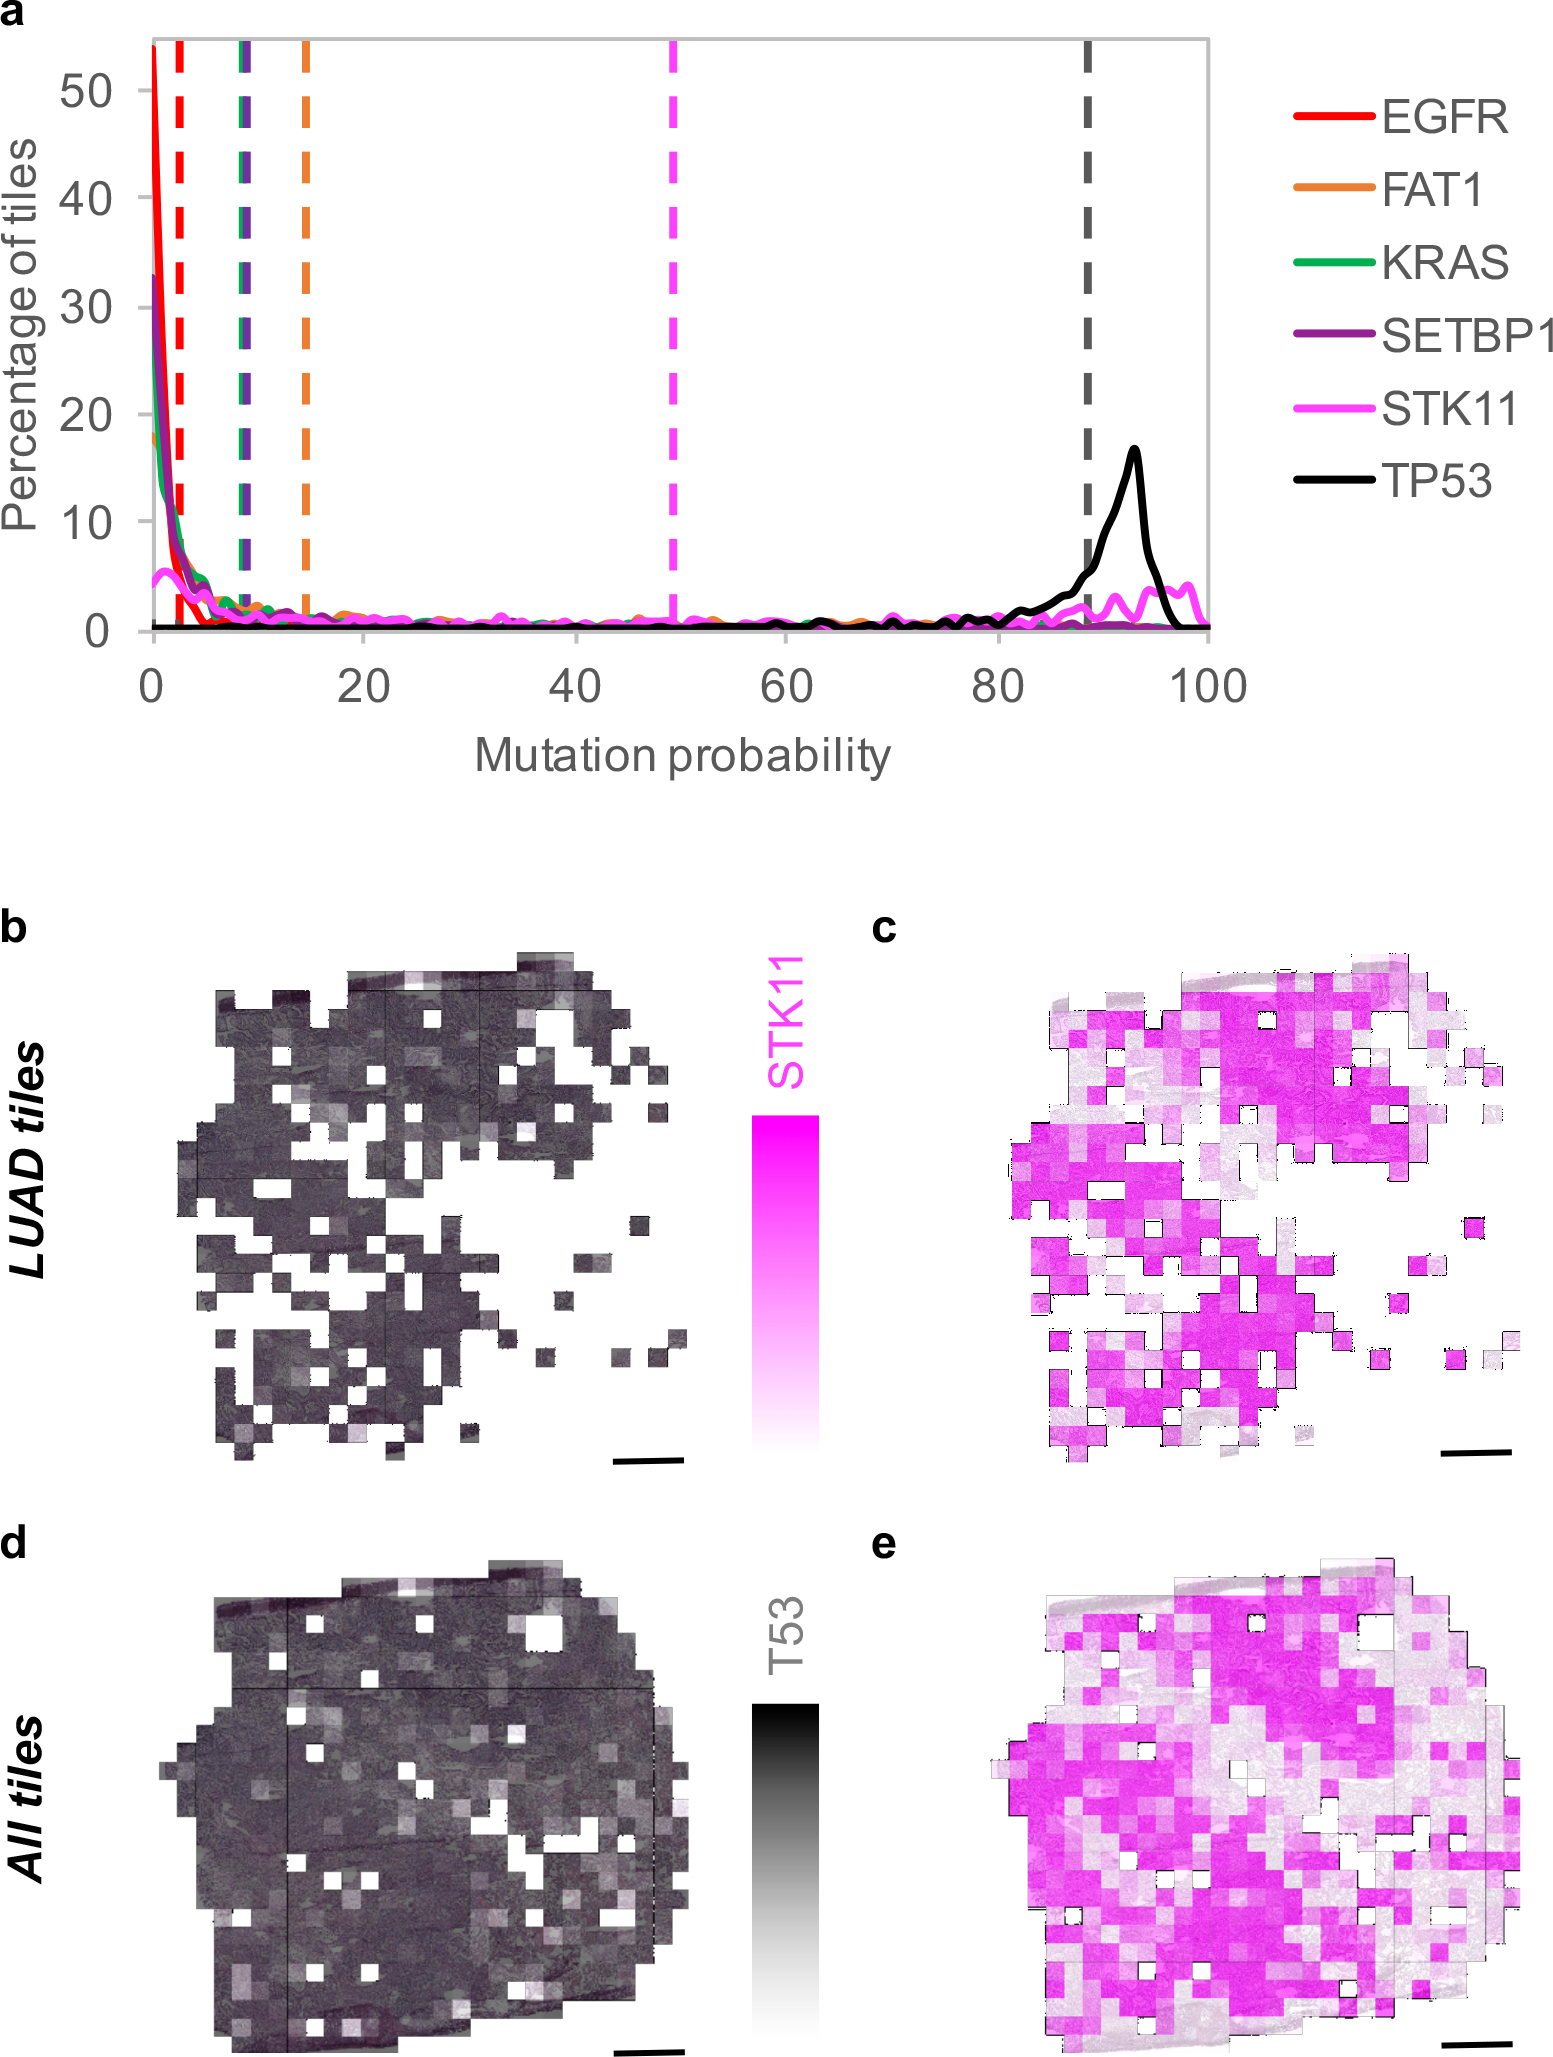
Figure 4. Spatial heterogeneity of predicted mutations.

(a) Probability distribution on LUAD tiles for the 6 predictable mutations with average values in dotted lines (n=327 non-overlapping tiles). The allele frequency is 0.33 for TP53, 0.25 for STK11 and 0 for the 4 other mutations. (b) heatmap of TP53 and (c) STK11 when only tiles classified as LUAD are selected, and in (d) and (e) when all the tiles are considered. Scale bars are 1 mm.
