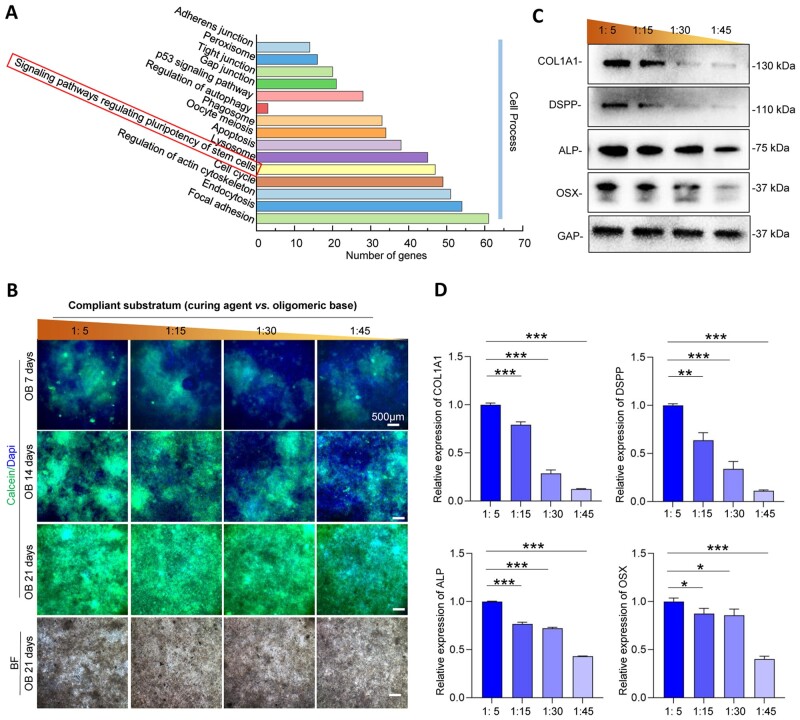
Figure 2.
DPC odontogenic differentiation on substrates with different stiffnesses. (A) Gene statistics of KEGG classification associated with cell process, comparing the 1:5 (the stiffest) group with 1:45 (the softest) group. (B) Calcein staining of mineralized nodule formation after osteogenic induction for 7, 14 and 21 days. (C) The representative images of odontogenic markers on PDMS surfaces in different stiffnesses by western blotting. (D) Relative quantification of the expression levels of odontogenic markers (n = 3). Data are means ± SD, *P < 0.05, **P < 0.01, ***P < 0.001.

