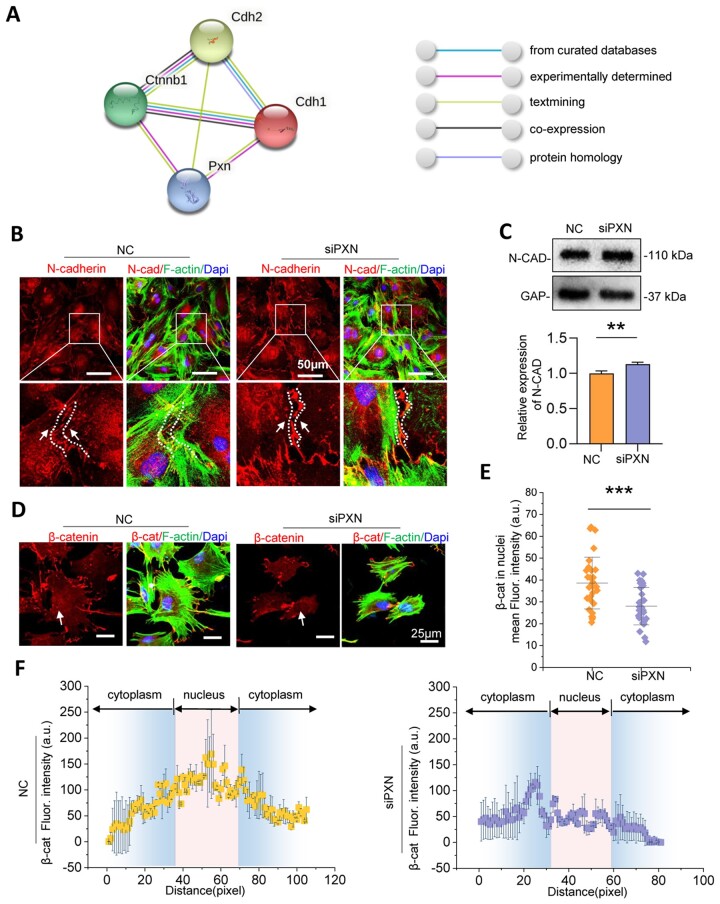
Figure 4.
N-cadherin/β-catenin expression and distribution are regulated by paxillin. (A) STRING analysis of the relationship between paxillin and N-cadherin (or E-cadherin)/β-catenin. N-cadherin (gene name was cdh2), E-cadherin (gene name was cdh1) and β-catenin (gene name was ctnnb1). (B) Representative immunofluorescence images of N-cadherin distribution in DPCs after treatment with siPXN. (C) N-cadherin expression levels detected by western blotting after the treatment of siPXN and the relative quantification (n = 3). (D) Representative immunofluorescence images of β-catenin distribution after treatment with siPXN (n = 30). (E) The mean fluorescence intensity of β-catenin in nuclei with or without treatment with siPXN. (F) The linear profile of β-catenin intensity distribution based on the immunostaining image. Data are means ± SD, **P < 0.01, ***P < 0.001.

