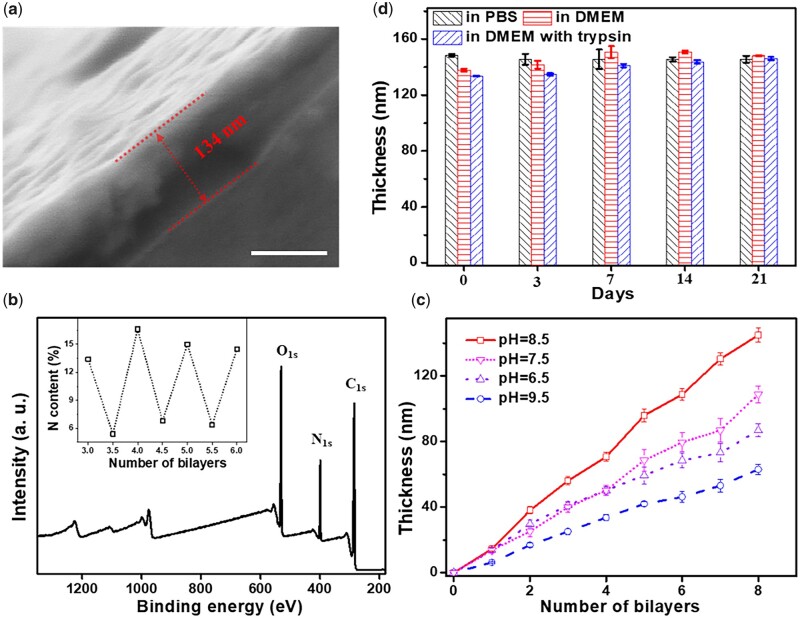
Figure 2.
(a) SEM images of the cross-section of (PC/collagen)8 fabricated at pH 8.5. (b) XPS analysis of (PC/collagen)4. The content (%) of N was dependent on the outermost material (the integers in the x-axis are the outermost layers of the PC, the other points were the outermost layers of collagen) of PC/collagen fabricated at pH 8.5. (c) The relationship between the thickness of PC/collagen coating and the number of bilayers prepared at different pH values. (d) The thickness of (PC/collagen)8 fabricated at pH 8.5 after incubating in different solutions for different days. The scale bar is 100 nm.

