Figure 3.
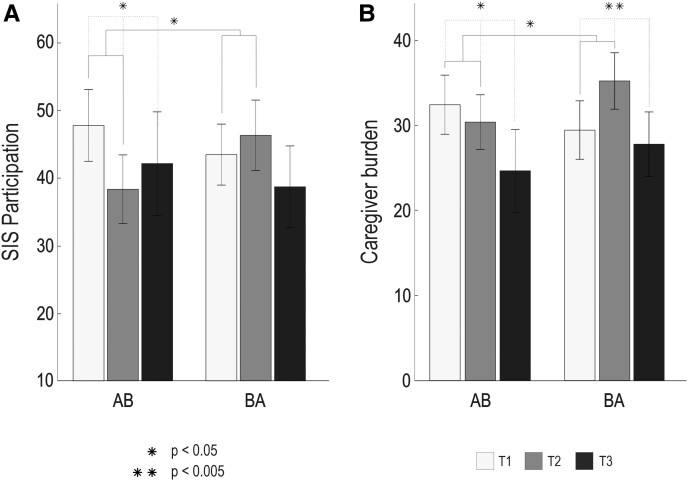
Functional outcome and caregiver burden results from the LMM analysis (N = 50). (A) SIS participation and role function (F = 6.440, P = 0.015). (B) Caregiver burden as measured by GHQ-12 and ZBI-22 (F = 6.765, P = 0.014). AB received the intervention from T1 to T2, and BA received the intervention from T2 to T3. The statistical method used in this study was the LMM analysis. The bar plots (mean—SEM) show changes in test scores over the three time-points (T1–T3) presented group-wise (AB/BA). Significant Time × Group interactions are shown with solid lines. Time main effects are shown with dashed lines. GHQ-12, General Health Questionnaire 12; LMM, linear mixed effects model; SEM, standard error of the mean; SIS, Stroke Impact Scale; T1, timepoint 1 (baseline); T2, timepoint 2 (5-month); T3, timepoint 3 (9-month); ZBI-22, Zarit Burden Interview 22.

