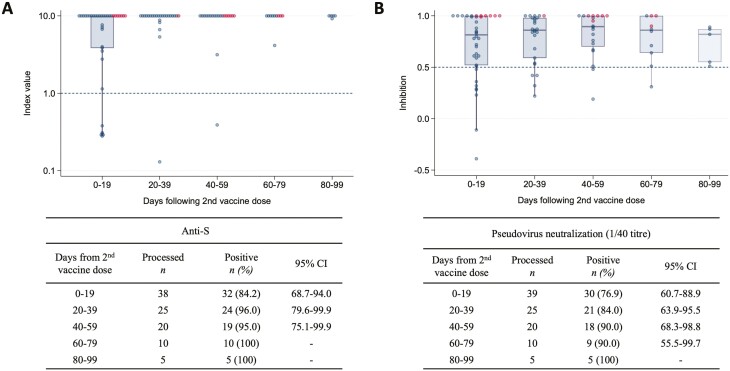
Figure 3.
Longitudinal analysis of SARS-CoV-2 vaccine immunogenicity following 2nd vaccine dose. Box plot of anti-S index values (A) and pseudovirus neutralisation (titre 1/40) in all vaccinated patients (B) at time periods relative to the date of 2nd SARS-CoV-2 vaccine dose. Each data point represents a serum sample. Solid lines denote the median and boxes represent the interquartile range. Samples from patients with positive nucleocapsid results are marked in red and negative in blue. Prespecified positivity thresholds are denoted by dotted lines (anti-S > 1.0, anti-S > 1.0, pVNT(1/40) > 0.5).

