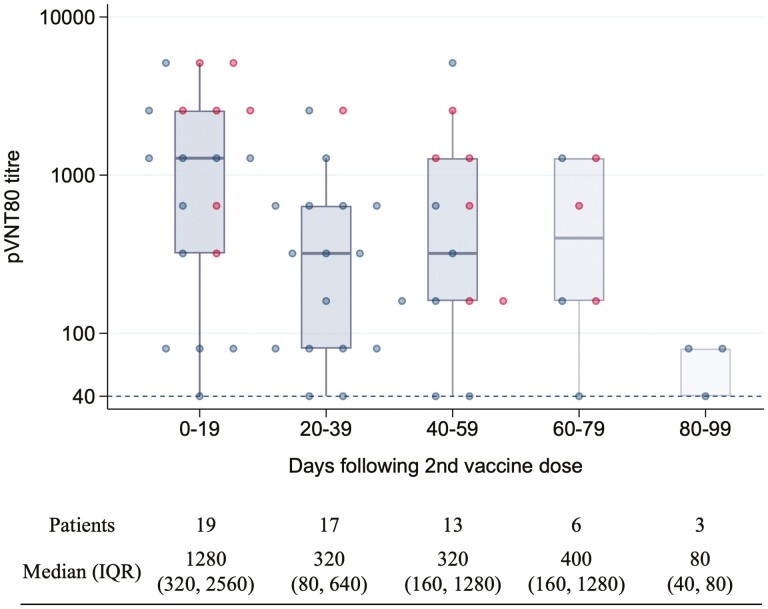
Figure 4.
Box plots of pVNT80 neutralization titers after the 2nd dose of SARS-CoV-2 vaccine. A logarithmic scale was used for neutralization titre. Each data point represents a serum sample. Solid lines denote the median and boxes represent the interquartile range. Samples from patients with positive nucleocapsid results are marked in red and negative in blue.

