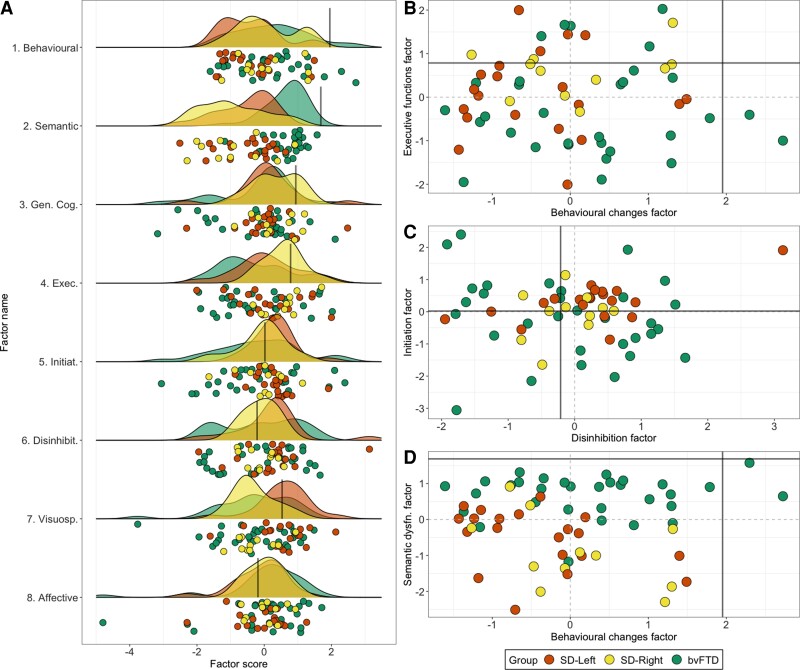
Figure 3 Factor scores for bvFTD and SD patients on emergent factors.
(A) Raincloud plots showcasing group-level density of distribution (cloud) and individual jittered points (rain) of performance variation across PCA-derived factors for bvFTD and SD patients. Scatter plots for select factors displaying relationships between (B) Behavioural changes (Factor 1) with Executive function (Factor 4), (C) Initiation (Factor 5) and Disinhibition (Factor 6) factors, and (D) Behavioural changes (Factor 1) and Semantic dysfunction (Factor 2) factors. In all plots, black lines indicate lower bound of normality (−1.96 SEM) as estimated from the Control group (calculation detailed in Supplementary Methods). Positive scores approaching the lower bound of normality indicate better performance. Statistical comparisons run using ANOVA with post hoc comparisons using Sidak corrections indicated significant group differences in Semantic dysfunction factor [Factor 2: F(2,59) = 25.3; P < 0.001; = 0.46] with both SD groups performing significantly poorer than the bvFTD group (all P < 0.001) but comparably to each other (P > 0.1); Executive factor [Factor 4: F(2,59) = 3.1; P = 0.05; = 0.09] where the bvFTD group performed significantly worse than the SD-Right group (P = 0.007); and the Visuospatial factor [Factor 7: F(2,59) = 5.1; P = 0.008; = 0.14] where both bvFTD and SD-Right patients performed poorer than the SD-Left group (both P-values < 0.01), with no significant differences between bvFTD and SD-Right groups (P > 0.1). No other significant differences emerged. bvFTD, behavioural variant frontotemporal dementia; SD, semantic dementia.

