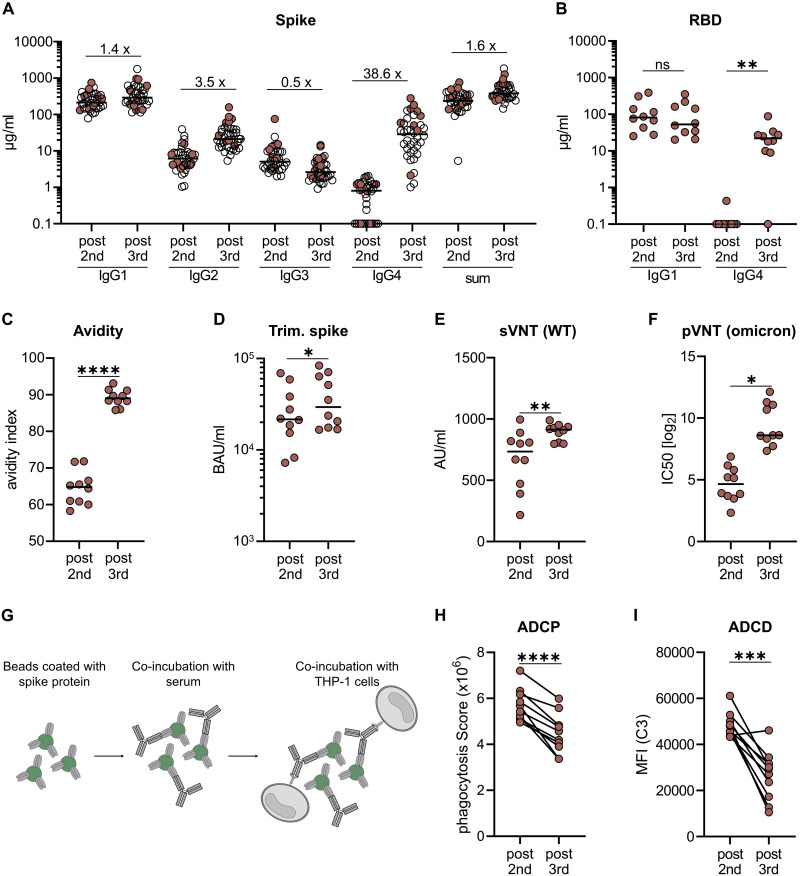
Fig. 3. Comparison of functional antibody responses after two or three mRNA vaccinations.
From a second cohort of 38 vaccinees having received three immunizations with Comirnaty (see Table 1, cohort 2), we selected ten persons to characterize the vaccine-induced antibody profile (indicated by filled circles). Only one individual in this cohort showed a positive nucleocapsid serology, despite no anamnestic clinical breakthrough infection, and was not included in the smaller sub-cohort used for functional testing. Paired serum samples collected after the second (post second) or the third (post third) vaccination were analyzed. The IgG subclass distribution measured in the flow cytometric assay and the sum of all IgG are shown for the whole cohort (A). The amounts of RBD-specific IgG1 and IgG4 (B) and the avidity (C) were determined by ELISA. For avidity measurements, sera were normalized according to total anti-S IgG levels and equal amounts of specific IgG were used. A fully automated CLIA assay was used to measure antibodies binding to trimeric spike protein. Antibody levels were quantified according to the WHO International Reference standard and given as BAU/ml (D). The neutralizing capacity was determined in a surrogate VNT against WT (E) and in a pseudotype VNT against the Omicron VOC (F). Antibody-dependent phagocytosis by the monocytic THP-1 cell line (G) was analyzed by using either monoclonal RBD antibodies of the different subclasses (Fig. S7) or the paired sera. The phagocytosis score is calculated as follows: % of THP-1 bead-positive x mean fluorescence intensity of bead-positive (H). Antibody-dependent complement deposition was analyzed on spike-coated microbeads after incubation with the paired sera. C3 deposition was detected by fluorescently labeled antibodies and mean fluorescence intensity of complement-loaded beads are shown (I). Circles represent individual sera and solid lines indicate the median (H, I). Statistical comparison for the two time points were done by a paired T-test. *p < 0.05, **p < 0.01, ***p < 0.001, ****p < 0.0001, and n.s. indicates not significant.

