FIGURE 1.

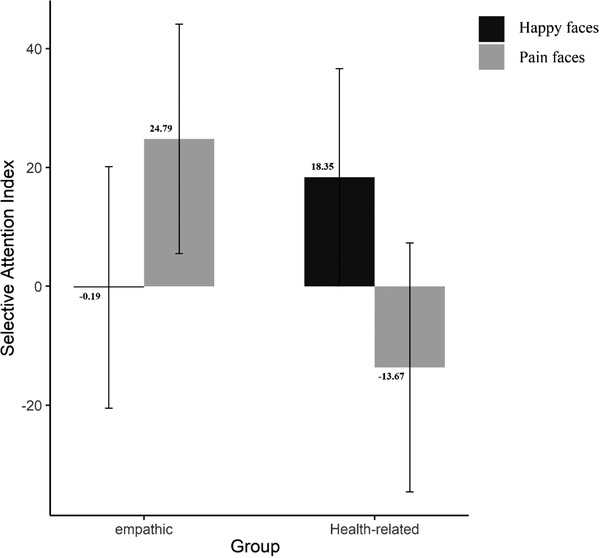
Selective attention index for pain and happy faces for two groups (errors bars represent 95% confidence interval, and numbers above or below the bars show the exact mean of selective attention index for each condition and group)

Selective attention index for pain and happy faces for two groups (errors bars represent 95% confidence interval, and numbers above or below the bars show the exact mean of selective attention index for each condition and group)