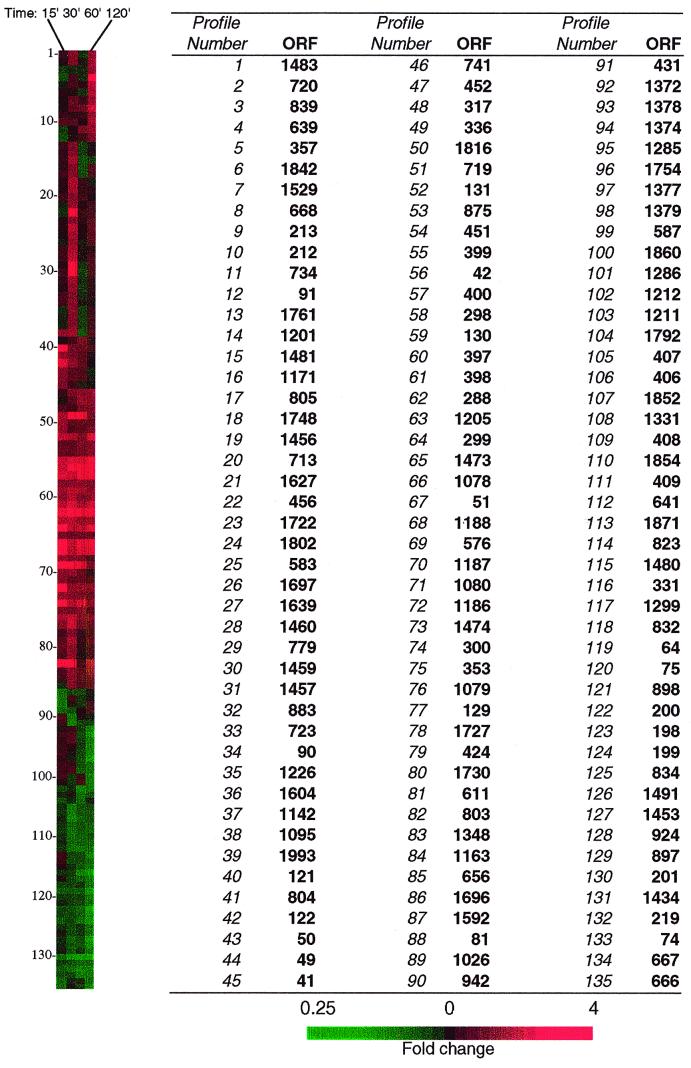
FIG. 1.
Hierarchical clustering of 135 P. multocida ORFs that had significantly altered expression levels under low iron conditions. Clustering and visualization were performed using the software programs Cluster and Treeview. Red and green colors represent fold increase and decrease, respectively, in gene expression in response to low iron conditions. The gene expression profiles for the 15-, 30-, 60-, and 120-min time points are shown in the panel on the left, and corresponding ORF numbers in the P. multocida genome are also shown.

