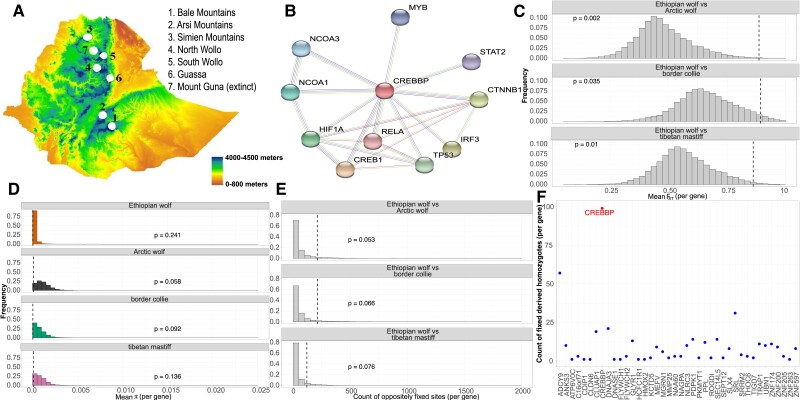
Fig. 4.
Signals of high-altitude adaptation in the Ethiopian wolf. (A) Topography of the Ethiopian wolf habitat and sub-population locations. The lowest altitude begins at sea level and the highest altitude where the Bale Mountain population resides is approximately 4000 meters above sea level. Topography is modified from Gutema et al. 2018. (B) The primary protein-interaction network for CREBBP (represented by a red node) in Canis lupus familiaris from STRING (Szklarczyk et al. 2016). Each node represents a protein-coding gene, and the edges represent protein–protein associations that contribute to a shared function. The colors of each edge represent methods of validation of interactions (turquoise: curated database; purple: experimentally curated; green: text mining, black: co-expression). For (C)–(E), the vertical dashed line indicates where CREBBP falls in the distribution. P-values were computed as the proportion of genes with summary statistic values as or more extreme than what was observed for CREBBP. (C) The distribution of unweighted mean FST per gene when comparing the Ethiopian wolf to each reference population. (D) Distribution of π per gene for each population. (E) The distribution of oppositely fixed sites (fixed as ancestral in Ethiopian wolf and derived in comparison population or the converse) per gene when comparing the Ethiopian wolf with each reference population. (F) The count of fixed derived homozygous alleles in each gene within a 1 Mb window around CREBBP. CREBBP has the largest number of fixed derived sites.

